FIGURE SUMMARY
Title

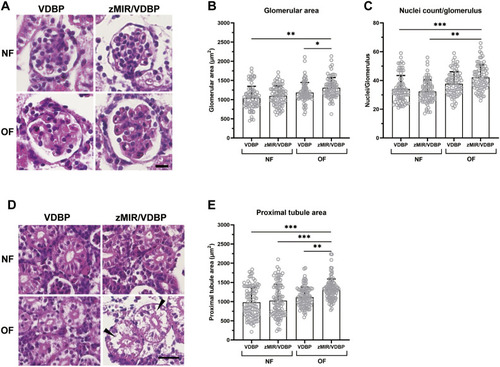
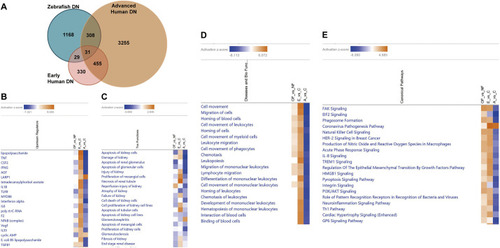
Development of a novel zebrafish model of diabetic nephropathy

Authors
Zang, L., Saitoh, S., Katayama, K., Zhou, W., Nishimura, N., Shimada, Y.
Source
Full text @ Dis. Model. Mech.

Overfed zMIR/VDBP zebrafish exhibit obesity, hyperglycemia and glomerular filtration barrier dysfunction. (A) Experiment schema of overfeeding to induce diabetes. Female VDBP and zMIR/VDBP zebrafish were divided into normal-feeding (NF) and overfeeding (OF) groups. Proteinuria measurements were performed every 2 weeks for a total of 20 weeks. At the endpoint, renal histopathology was analyzed using Hematoxylin and Eosin staining and transmission electron microscopy. (B) Representative images of VDBP and zMIR/VDBP zebrafish with NF and OF for 20 weeks. (C,D) Quantification of body weight (BW) (C) and fasting blood glucose (FBG) (D) of the four groups at the endpoint of the feeding experiment (n=5). (E) Proteinuria changes in the urine every 2 weeks during the overfeeding experiment in overfed VDBP and zMIR/VDBP zebrafish (n=5-22). The VDBP-GFP signal was measured using ELISA as an indicator of albuminuria. Data are presented as means±s.e.m. ns, not significant; ***P<0.001 versus VDBP with OF; Bonferroni–Dunn multiple comparisons test.

Overfed zMIR/VDBP zebrafish develop glomerular morphological changes. (A) Hematoxylin and Eosin (H&E)-stained paraffin kidney sections revealed marked glomerular hypertrophy in overfed zMIR/VDBP zebrafish. Scale bar: 10 μm. (B,C) Quantification of glomerular area (B) and average nuclear count per glomerular cross-section (C) in the four groups. At least 75 glomeruli from five fish per group were measured on three sections per fish. (D) H&E-stained sections from overfed zMIR/VDBP zebrafish showed pale cytoplasms with proximal tubule enlargement. Black arrowheads indicate the cavities in the proximal tubule, which may be caused by ectopic lipid accumulation. Scale bar: 20 μm. (E) The cross-sectional area of the proximal tubules in overfed zMIR/VDBP fish was significantly larger than that in those fed a control diet or overfed VDBP fish. At least 100 tubular cross-sections were measured in each group. Data are presented as mean±s.e.m. *P<0.05; **P<0.01; ***P<0.001; Bonferroni–Dunn multiple comparisons test.

Transmission electron microscopy images of glomeruli from the four groups of zebrafish. White arrowheads show eosinophil infiltration in overfed zMIR/VDBP fish. Images are representative of four fish per group. Scale bar: 10 μm.

Overfed zMIR/VDBP zebrafish develop thick glomerular basement membranes. (A) Representative transmission electron microscopy images of the glomerular basement membrane (GBM) and foot processes of the four groups. The podocytes (p), endothelium (e) and GBM are marked on the images. Scale bar: 500 nm. (B) Summary of the GBM thickness of the four groups of zebrafish. GBM thickness was measured at ten randomly assigned points in each image from four fish/group. (C) Foot process width analysis revealed that foot process effacement was present in overfed zMIR/VDBP fish. At least 20-70 podocyte foot processes were measured in each group. Data are presented as mean±s.e.m. ***P<0.001; Bonferroni–Dunn multiple comparisons test.

Calorie restriction restores the glomerular filtration barrier dysfunction in overfed zMIR/VDBP zebrafish. (A) Experiment schema. Zebrafish with DN were divided into calorie restriction [CR, fed with the same amount as normally fed (NF) fish] and continuously overfeeding (DN) groups. The experiment duration was 6 weeks. Proteinuria measurement was performed at the endpoint, and the renal histopathology was analyzed by H&E staining. (B) CR caused a slight decrease in body weight (BW) compared to that in DN fish (n=6-7). (C) CR caused a significant decrease in fasting blood glucose (FBG) levels compared to those in DN fish (n=6-7). (D) CR treatment significantly decreased proteinuria leakage compared to that in zebrafish with DN (n=6-7). (E) Representative images of the glomeruli of the three groups of zebrafish. CR treatment significantly decreased the glomerular hypertrophy observed in zebrafish with DN. Scale bar: 20 μm. (F) Representative images of the proximal tubule area of the three groups of zebrafish. Scale bar: 20 μm. (G,H) CR treatment resulted in a return to normal glomerular area (G) and proximal tubule size (H). Each group had 45 separate glomeruli and proximal tubules analyzed from three fish in each group. Data are presented as mean±s.e.m. *P<0.05; **P<0.01; ***P<0.001; Bonferroni–Dunn multiple comparisons test.

Comparative transcriptome analysis results for zebrafish DN, early human DN and advanced human DN. (A) Venn diagram for the overlapping differentially expressed genes (DEGs) among zebrafish DN, early human DN and advanced human DN. (B-E) Heatmaps show the results of comparing functional Ingenuity Pathway Analysis (IPA) of the three groups, including the top 20 upstream regulators (B), toxicity functions (nephrotoxicity) (C), disease and biofunctions (D) and canonical pathways (E). Regulators, functions and pathways are ranked based on the z-score that predicts activation (orange) and inhibition (blue). OF_vs_NF, overfeeding versus normal feeding; E_vs_C, early human DN versus human control; A_vs_C, advanced human DN versus human control.

PI3K/Akt signaling pathways identified by IPA in the zebrafish DN, early human DN and advanced human DN. PI3K/Akt signaling pathway was activated in zebrafish DN (A) and early human DN (B) but was inhibited in advanced DN (C). Upregulated and downregulated DEGs are shown in red and green, respectively, and the predicted activation and inhibition effects of signaling intermediates and pathways are shown as orange and blue lines, respectively. Asterisks in A indicate that multiple identifiers in the dataset file map to a single gene or protein in the global molecular network.

Metformin ameliorates the proteinuria leakage and FBG levels in the DN zebrafish model. (A) Schematic of overfeeding and metformin treatment. zMIR/VDBP zebrafish were overfed for 8 weeks and proteinuria was measured for DN fish selection. Then, DN fish were divided into two groups of DN only and DN with metformin treatment, and continued overfeeding for 1 week. (B) Metformin caused a significant decrease in fasting blood glucose (FBG) levels compared to those in DN fish (n=6). (C) Metformin treatment significantly decreased proteinuria leakage (n=6). (D) The ratio of phosphorylated Akt (pAkt)/total Akt expression in kidney tissue was higher in metformin-treated DN zebrafish than in the control DN group (n=4). Data are presented as mean±s.e.m. *P<0.05; two-tailed unpaired t-test.

Acknowledgments
This image is the copyrighted work of the attributed author or publisher, and ZFIN has permission only to display this image to its users. Additional permissions should be obtained from the applicable author or publisher of the image. Full text @ Dis. Model. Mech.