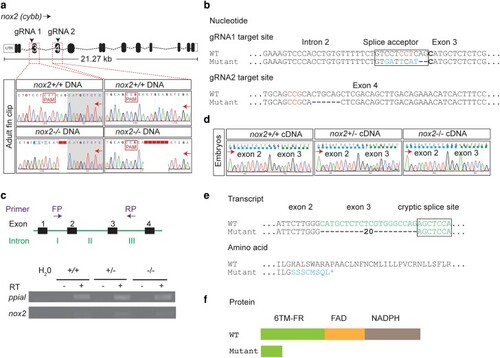
Genetic and molecular characterization of adult
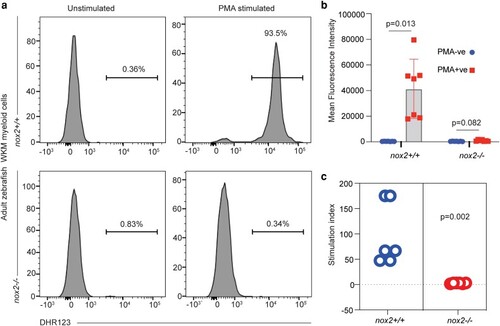
 nox2 zebrafish. a) Sanger sequencing chromatogram of genomic DNA at gRNA 1 (intron 2/exon 3) and gRNA 2 (exon 4) target sites in adult WT (upper panel) and nox2 (lower panel) homozygous zebrafish. DNA sequence disruptions are around the protospacer adjacent motif (PAM)—NGG. b) Interpretation of nucleotide sequences in panel a, at the gRNA 1 and gRNA 2 target sites. c) Schematic of PCR forward primer (FP) and reverse primer (RP) binding sites for amplifying cDNA transcripts (above). Gel image showing RT-PCR products from nox2 WT, heterozygous, and homozygous zebrafish embryos (below). d) Sanger chromatogram showing cDNA sequence traces of nox2 WT, heterozygous, and homozygous zebrafish embryos from RT-PCR in panel c. Exons separated by colored broken lines. e) Interpretation of nucleotide sequence and predicted amino acid sequence of WT and nox2 homozygous in panel d. f) Schematic of predicted protein domains in WT and nox2 zebrafish. nox2, NADPH oxidase 2; gRNA, guide RNA; PAM, protospacer adjacent motif; 6TM-FR, heme containing 6 transmembrane ferritin reductase domain; FAD, flavine adenine dinucleotide domain; NADPH, nicotinamide adenine dinucleotide phosphate domain; +/+, WT; +/−, heterozygous; −/−, homozygous; green font, exon 3 sequence; blue font, sequence mismatch; asterisk (*), premature stop; purple arrows, direction of sequencing; FP, forward primer; RP, reverse primer; RT, reverse transcriptase.

ROS deficiency in adult nox2−/− zebrafish myeloid cells. a) Representative histograms of DHR123 staining flow analysis in nox2+/+ (upper panels) and nox2−/− (lower panels) adult WKM myeloid cells. b) Comparison of MFI of DHR123 between unstimulated and PMA-stimulated myeloid cells from nox2+/+ and nox2−/− WKM. c) PMA stimulation index of ROS for nox2+/+ and nox2−/− WKM myeloid cells. DHR123, dihydrorhodamine 123; MFI, mean fluorescence intensity; WKM, whole kidney marrow; +/+, WT; −/−, homozygous mutant; N, nox2+/+, 7; nox2−/−, 7. Turkey's multiple comparison (b); Mann–Whitney (c); P < 0.05.

Reduced viability of embryos carrying the nox2 mutant allele. a) Survival curve of concurrent cohorts of WT and nox2−/− zebrafish embryos. b) Survival curve of concurrent cohorts of WT, nox2+/−, and nox2−/− zebrafish embryos. c) Twenty-four (24) h viability of nox2 WT, heterozygous, and homozygous zebrafish embryos. Panels a, b, and c were performed independently on different days and represent cohorts of genotype-identical embryos assayed in parallel. N-values in brackets (a, b) and within columns (c)—note that although N-values are similar, a and b are independent experiments; +/+, WT; +/−, heterozygous; −/−, homozygous. Log-rank (Mantel–Cox) tests (a, b), Fisher’s exact test (c), P < 0.0001.

Acute neutrophil inflammatory response in nox2 zebrafish embryos. a, c) Number of neutrophils throughout the trunk following tail fin injury (a) and notochord injury (c). b, d) Number of neutrophils at wound following tail fin injury (b) and notochord injury (d). Tail fin injury, N = 16(+/+), 50(+/−), and 21(−/−); notochord injury, N = 14 (+/+), 28 (+/−), and 17 (−/−); WT; +/−, heterozygous; −/−, homozygous. Pooled data of 3 independent experiments. Bars indicate mean ± SD. Two-way ANOVA with Tukey's multiple comparisons test, P < 0.05.

Acknowledgments
This image is the copyrighted work of the attributed author or publisher, and ZFIN has permission only to display this image to its users. Additional permissions should be obtained from the applicable author or publisher of the image. Full text @ G3 (Bethesda)