
- Title
-
Methamphetamine effects in zebrafish (Danio rerio) depend on behavioral endpoint, dose and test session duration
- Authors
- Schenk, S., Horsfield, J.A., Dwoskin, L., Johnson, S.L.
- Source
- Full text @ Pharmacol. Biochem. Behav.

Mean (± standard error) changes in zebrafish behavior (transitions up and down the sides of the arena, time spent in the bottom zones, and visits to the top zones) following exposure to various doses of methamphetamine over a 50-min assay. A, C and E show the sum of the behavioral measure across the 50-min sessions. B, D, and F show the behavior data broken down by 5-min time bins across the session. Asterisks indicate doses that are significantly different from the control (0 mg/L). Sample sizes for each dose (mg/L): 0 (n = 9), 0.1 (n = 7), 0.3 (n = 10), 1.0 (n = 6), 3.0 (n = 7). |
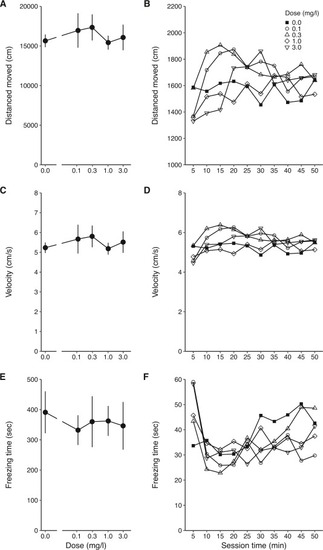
Mean (± standard error) changes in zebrafish behavior (distanced moved, velocity, freezing time) following exposure to various doses of methamphetamine over a 50-min assay. A, C and E show the sum (or mean for velocity) of the behavioral measure across the 50-min sessions. B, D, and F show the behavior data broken down by 5-min time bins across the session. Sample sizes for each dose (mg/L): 0 (n = 9), 0.1 (n = 7), 0.3 (n = 10), 1.0 (n = 6), 3.0 (n = 7). |