FIGURE SUMMARY
Title

Outlining cardiac ion channel protein interactors and their signature in the human electrocardiogram

Authors
Maurya, S., Mills, R.W., Kahnert, K., Chiang, D.Y., Bertoli, G., Lundegaard, P.R., Duran, M.P., Zhang, M., Rothenberg, E., George, A.L., MacRae, C.A., Delmar, M., Lundby, A.
Source
Full text @ Nat Cardiovasc Res

MS evaluation of cardiac ion channel IPs.

a, Workflow of the study. We performed MS measurements of immunoprecipitated channels and their interactors and of control IPs from quadruplicate murine cardiac tissue lysates. Deep proteome measurements of the membrane-enriched mouse heart samples utilized in the IP experiments were also performed. Bioinformatics network analyses prioritized interactors for functional evaluation. A subset of interactors were evaluated for their functional impact on cardiac electrophysiology by STORM imaging, optical mapping in zebrafish KOs, and patch clamping of cardiomyocytes from mice with interactor genes silenced. From multi-omics data integration, the impact of each interactor in human electrophysiology is evaluated. b, Dendrogram from unsupervised hierarchical cluster analysis of protein intensities of proteins identified in IP experiments show that the four replicate experiments all cluster together. The clustering follows the bait replicates. c, Pearson correlation coefficients for protein intensities of the four Cacna1c replicate pulldown experiments. Pearson correlation coefficients are indicated in each scatter plot. Parts of the figure were drawn by using pictures from Servier Medical Art. Servier Medical Art by Servier is licensed under a Creative Commons Attribution 3.0 Unported License (https://creativecommons.org/licenses/by/3.0/).

Source data

Volcano plot representation for analysis of significant interactors for each channel bait.

Volcano plots for each ion channel bait. a, Cacna1c. b, Kcnma1. c, Kcnn3. d, Kcnq1. e, Kcnh2. f, Kcnj5. g, Kcnj3. h, Kcnj2. i, Kcnd2. j, Kcna5. k, Gja1. l, Hcn4. m, Scn5a. All dots represent a protein, where the negative logarithm (base 10) of t-test-derived P value is shown as a function of logarithmic (base 2) ratios of protein intensities in bait pulldowns relative to controls. The control comparator is based on median protein intensities across 64 IP experiments, IgG pulldowns and scaled proteome measurements as well as imputation, and the black line indicates an FDR-based cutoff that considers the fold change difference of protein intensities to demarcate the specific from nonspecific interactors. The claim to significance was based on FDR of a two-sided t-test and s0 value (s0 controls the relative importance of t-test-based P value and difference between means). For details, see Extended Data Fig. 2b and Supplementary Table 2. Proteins shown as light-blue dots represent specific interactors for the bait, red dot is the bait protein itself, dark-blue dot represents interactors with previously reported functional influence on the bait, and yellow dots are protein interactors that we have prioritized for functional investigations based on evaluation of the acquired MS data.

Source data

Functional evaluation of channel interactors by gene knock out in zebrafish

The functional consequences after acute KO of six interactors of three major ion channels—Kcnq1 (Nebl and Nrap), Cacna1c (Inf2) and Scn5a (Glipr2, Epn2 and Gsn)—were evaluated in zebrafish. a, Compared with control siblings (WT, n = 16 fish), KO of the gene encoding Kcnq1-interacting nebl (nebl KO, n = 23) led to prolongation of the ventricular action potential starting shortly after the plateau, with the greatest effect size at slower heart rate and later in repolarization (APD80, action potential duration measured at 80% recovery; bpm, beats per minute; **P = 8.4 × 10−3; *P = 0.037 by two-sided Mann–Whitney U test; exemplar amplitude-normalized optical action potentials shown below), reduced ventricular CV (sinus rhythm; **P = 4.2 × 10−3 by idem; exemplar relative activation time maps are zero-referenced to activation of the AV-Ring; white stars indicate area of global earliest activation, isochrones denote 5 ms intervals), and increased spatial dispersion of repolarization (σ-Repol80, standard deviation of repolarization time at 80% recovery across the chamber; sinus rhythm; **P = 8.74 × 10−3, idem; in exemplar relative repolarization80 time maps, each chamber is zero-referenced to median repolarization time). b, KO of Kcnq1-interacting nrap (n = 29) led to prolongation of ventricular action potential with greatest effect size in early repolarization (APD20) and at faster heart rates (*P = 0.016; **P = 5.22 × 10−3, idem, nWT = 27). c, Knockdown of Cacna1c-interacting inf2 (n = 10) caused a significant decrease in ventricular CV (***P = 7.2 × 10−4, idem, nWT = 7). d, KO of Scn5a-interacting glipr2/glipr2l (n = 14) decreased ventricular CV (*P = 0.013) and rate of the action potential upstroke (Vmax; ***P = 2.61 × 10−4, exemplar amplitude normalized action potential upstrokes shown) as well as increasing ventricular APD (**P = 2.7 × 10−3, all by idem, nWT = 9). e, KO of Scn5a-interacting epn2 (n = 16) resulted in decreased ventricular CV (*P = 0.020) and increased ventricular APD80 (*P = 0.035, idem, nWT = 18). f, Decrease in ventricular CV was also observed after KO of Scn5a-interacting gsna/b (n = 11, *P = 0.027, idem, nWT = 10). Each point in the box plots corresponds to an individual zebrafish embryo. Box plots indicate 25th/50th/75th percentiles, while whiskers extend to the most extreme data within 1.5× of interquartile range beyond box limits.

Source data

shRNA silencing of sodium channel interactors, Epn2 and Gsn, increase sodium current density in mouse ventricular cardiomyocytes.

a, Voltage clamp protocol (top) and representative sodium current (INa) traces measured from adult cardiomyocytes expressing only GFP (GFP; bottom left) or GFP as well as shRNA for Epn2 (Epn2 knockdown (KD); bottom right). b, Current (I) to voltage (Vm) relationship of INa obtained from cardiomyocytes that were not injected (‘control’; solid circles), expressing only GFP (GFP; open squares) or from expressing GFP and shRNA for Epn2 (Epn2 KD; open diamonds). The data show increased peak sodium current density in Epn2 KD (*P = 0.014, linear mixed-effects analysis followed by Bonferroni post hoc analysis for multiple comparison testing). c, Sodium current activation measured for Epn2 KD, GFP or uninjected controls. d, Representative INa traces in GFP-expressing cardiomyocytes (bottom left) and in Gsn2 KD cardiomyocytes (bottom right). e, I to Vm relationship of INa for Gsn KD cardiomyocytes compared to that of controls (maximum sodium current trending to be increased for Gsn KD, P = 0.181, linear mixed-effects analysis followed by post hoc Bonferroni correction). f, INa activation curves. The activation curve is negatively shifted in Gsn KD cardiomyocytes compared to that of myocytes expressing only GFP (V1/2,Gsn KD = −57.4 ± 0.63 mV; V1/2,GFP = −53.4 ± 0.95 mV, *P = 0.037 linear mixed-effects analysis, followed by Bonferroni post hoc analysis for multiple comparison tests, control: n = 10 cells obtained from 3 mice; GFP: n = 9 cells obtained from 3 mice; Epn2 KD: n = 9 cells obtained from 4 mice; Gsn KD: n = 8 cells obtained from 4 mice; data are presented as mean ± standard error of the mean). g, Two-color STORM images for Scn5a (green) and Gsn (red) show 30% of Gsn clusters localizing within 20 nm of Scn5a clusters, 15 cells obtained from 3 mice in independent experiments. ‘Control’ are cardiomyocytes isolated from WT animals. ‘GFP’ are cardiomyocytes isolated from animals injected with an empty AAV vector. ‘Epn2 KD’ are cardiomyocytes isolated from mice with Epn2 silencing and ‘Gsn KD’ from mice with Gsn silencing. Multiple animals per group were necessary due to the limited number of datapoints that can be obtained from a single animal.

Source data

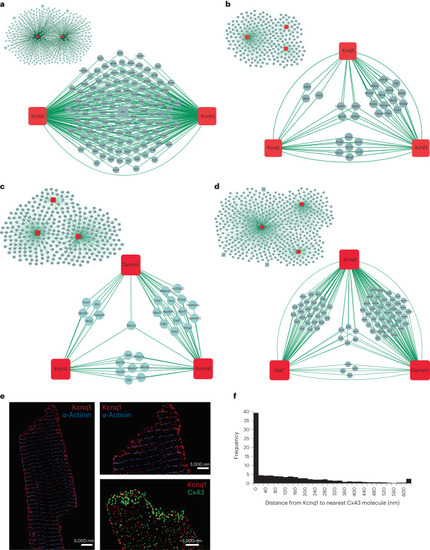
Inter-channel networks. Networks of shared proteins between channels found to interact.

ad, Kcnq1 and Kcnh2 (a), between Kcnj2, Kcnj3 and Kcnj5 (b), between Cacna1c, Kcnn3 and Kcnma1 (c), and between Kcnq1, Gja1 and Cacna1c (d). The inset panels show all shared interactors for these channels. The bait proteins are shown in red squares and the interactors in light-blue circles. Measured interactions are indicated by lines. Note the interactions between channel proteins. e, STORM images of murine cardiomyocytes for Kcnq1 (red) and Gja1 (green). α-Actinin shown in blue as a control. f, Quantification of images as those shown in e shows that 40% of Kcnq1 clusters localize within 20 nm from Gja1 clusters. Twenty cells were examined over three mice in independent experiments.

Source data

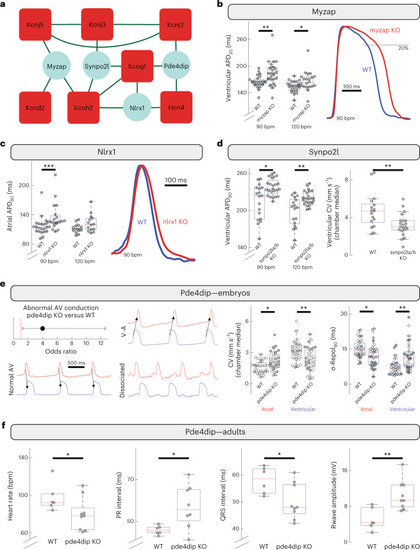
Functional evaluation of interactors shared across multiple channel networks.

Four proteins that each interact with three different ion channels were functionally investigated. a, Interactions identified for Myzap, Nlrx1, Pde4dip and Synpo2l. Bait proteins are shown in red, interactors in light blue and interactions in green. b, Acute KO in zebrafish of the gene encoding myzap (n = 25 fish) resulted in prolonged ventricular APD (APD20; **P = 2.85 × 10−3; *P = 0.018 by two-sided Mann–Whitney U test; exemplar amplitude-normalized optical action potentials shown) compared to control siblings (WT, n = 25). c, KO of nlrx1 (n = 21) mainly affected atrial APD, with a greater effect size in late repolarization (APD80) and at slower heart rates (nWT = 21, ***P = 7.64 × 10−4 by idem; exemplar amplitude normalized optical action potentials shown). d, KO of synpo2la/b (n = 23) led to prolonged ventricular APD at multiple paced heart rates with greatest effect size late in repolarization (nWT = 17, *P = 0.014; **P = 5.04 × 10−3, idem) and reduced ventricular CV (sinus rhythm; **P = 0.015, idem). e, KO of pde4dip (n = 30) resulted in hearts more prone to abnormal AV conduction (nWT = 30, odds ratio and 95% CI shown; P = 0.029 by Fisher’s exact test; exemplars show normal atrioventricular conduction versus retrograde conduction or AV dissociation), decreased ventricular CV and increased spatial dispersion of ventricular repolarization (standard deviation of repolarization time across the chamber), but with inverted effects in the atrial chamber (intrinsic rhythm; CV: *P = 6.24 × 10−3; **P = 5.86 × 10−3; σ-Repol80: *P = 0.013; **P = 1.66 × 10−4, idem). This reduces the differential between the chambers, which was observed in pde4dip-deficient fish with both abnormal AV conduction (filled markers) and normal (open markers). This suggests episodic abnormal AV conduction resulting in electrical remodeling with persisting effects during periods of normal AV conduction. f, In adult zebrafish, pde4dip deficiency (n = 9) resulted in slower heart rate (*P = 0.049), longer PR and shorter QRS intervals (*P = 0.029 and P = 0.036, respectively), and greater R wave magnitude (**P = 0.0095, all by idem, nWT = 6). Each point in the box plots corresponds to an individual zebrafish. Box plots indicate 25th/50th/75th percentiles, while whiskers extend to the most extreme data within 1.5× of interquartile range beyond box limits.

Source data

Network nodes associated with genetic influence on human heart ECG.

a, We constructed a combined protein–protein interaction network of all 13 channel interactomes, which in total comprise 881 protein interactors. Channel bait proteins are shown in red squares, interactors in gray-blue circles. Edges are colored to indicate clusters of ion channels that contribute to similar electrophysiological components. b, The network from a was filtered for proteins that were measured in human heart samples by analyzing more than a thousand MS-based proteomics measurement files from human heart samples. Ninety-two percent of the proteins in the network were identified in the human heart samples (details in Supplementary Fig. 4a and Supplementary Table 9). c, We utilized human heart single-nucleus RNA sequencing data to determine which of the interactors were expressed in human cardiomyocytes. We found evidence of expression for 98% of the interactors (details in Supplementary Fig. 4b and Supplementary Table 9). d, The remaining 796 human heart, cardiomyocyte-expressed, interactors were evaluated using ECG plotter tool. For each protein, this generates a time series of associations across the ECG cycle. For each protein, we report the most significant association. e, Refined network of the 13 channel bait proteins and their human heart-cardiomyocyte-expressed interactors. Bait proteins are depicted in squares, interactors in circles. The color of the nodes indicates the significance of the influence on the ECG as determined by ECG plotter. A darker red color indicates a more significant association. The 340 proteins with a significant influence (P < 8.23 × 10−7 resulting network supports the notion that the combined ion channel network is enriched for proteins that influence the cardiac ECG. GWAS P values were extracted from Verweij et al.33 and adjusted for multiple comparisons (details in Methods and Source Data Fig. 7). Parts of the figure were drawn by using pictures from Servier Medical Art. Servier Medical Art by Servier is licensed under a Creative Commons Attribution 3.0 Unported License (https://creativecommons.org/licenses/by/3.0/).

Source data

Acknowledgments
This image is the copyrighted work of the attributed author or publisher, and ZFIN has permission only to display this image to its users. Additional permissions should be obtained from the applicable author or publisher of the image. Full text @ Nat Cardiovasc Res