
- Title
-
Endothelial Cell Flow-Mediated Quiescence Is Temporally Regulated and Utilizes the Cell Cycle Inhibitor p27
- Authors
- Tanke, N.T., Liu, Z., Gore, M.T., Bougaran, P., Linares, M.B., Marvin, A., Sharma, A., Oatley, M., Yu, T., Quigley, K., Vest, S., Cook, J.G., Bautch, V.L.
- Source
- Full text @ Arterio., Thromb., and Vas. Bio.

Laminar flow–mediated quiescence is transcriptionally distinct. A, Quantification of epithelial quiescence score in human umbilical vein endothelial cell (HUVEC) scRNA data set by cluster (previously defined8). Static cells were visually checked for subconfluence and collected 48 hours post-seeding. B, Quantification of endothelial quiescence score in HUVEC scRNA data set by cluster. C, Endothelial quiescence score on bulk RNA seq data of HUVEC exposed to indicated stimuli, n=3 replicates. D and E, Heatmaps showing relative expression of cell cycle proliferation markers (green font) and inhibitors (red font) plotted using bulk RNA seq data of HUVEC under indicated conditions, n=3 replicates. Statistics, 1-way ANOVA with Tukey multiple comparison test. A.U. indicates arbitrary unit; Flow-M, flow maintenance (laminar flow [15 d/cm2 per 72 hours]); MIX, endothelial cells from static and flow clusters; and scRNA, single-cell RNA. |

Endothelial cell flow maintenance (Flow-M) quiescence stimulus leads to shallow quiescence depth. A, Representative images of human umbilical vein endothelial cell (HUVEC) under static (nonflow) or Flow-M conditions with 5-ethynyl-2′-deoxyuridine (EdU) incorporation and fixation at indicated times post–Flow-M release. Cultures stained for DAPI (4′,6-diamidino-2-phenylindole; white, nuclear mask) and EdU (red, S phase) or phospho-retinoblastoma protein (pRB; blue, interphase). Scale bar, 50 µm. White arrow, flow direction. B, Quantification of percent EdU+ cells with indicated conditions. n=3 replicates, 5 images per condition per replicate. C, Quantification of percent pRB+ cells with indicated conditions. n=3 replicates, 5 images per condition per replicate. D, Representative images of HUVEC under indicated density conditions with EdU incorporation and fixation at indicated times post–high-density release. Cultures stained for DAPI (white, nuclear mask) and EdU (red, S phase) or pRB (blue, interphase). Scale bar, 50 µm. E, Quantification of percent EdU+ cells with indicated conditions. n=3 replicates, 6 images per condition per replicate. F, Quantification of percent pRB+ cells with indicated conditions. n=3 replicates, 6 images per condition per replicate. Statistics, 1-way ANOVA with Tukey multiple comparisons test. |

Cell cycle inhibitor p27 expression levels vary with endothelial quiescence stimulus. A, RT-qPCR (reverse transcription quantitative polymerase chain reaction) for CDKN1B levels under indicated conditions. n=3 replicates. B, Representative images of human umbilical vein endothelial cell (HUVEC) under indicated conditions stained for p27 (green) and DAPI (4′,6-diamidino-2-phenylindole; white, nuclear mask). Scale bar, 50 µm. White arrow, flow direction. C, Quantification of HUVEC p27+ cells under indicated conditions. n=3 replicates, 5 images per condition per replicate. D, RT-qPCR for CDKN1B levels under indicated conditions. n=3 replicates. E, Representative images of HUVEC under indicated conditions stained for p27 (green) and DAPI (white, nuclear mask). Scale bar, 50 µm. F, Quantification of HUVEC p27+ cells under indicated conditions. n=3 replicates, 5 images per condition per replicate. Statistics, Student 2-tailed t test. |
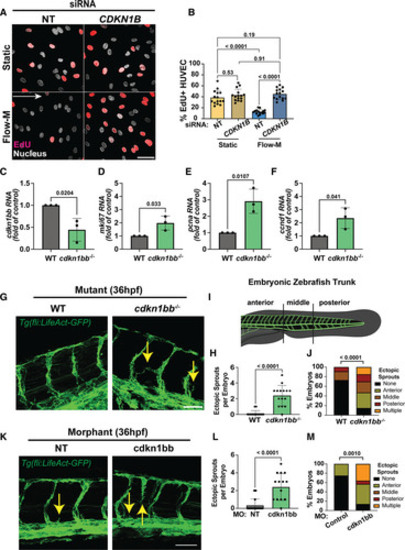
p27 establishes quiescence in endothelial cells and regulates cell cycle and vascular expansion in vivo. A, Representative images of human umbilical vein endothelial cell (HUVEC) with indicated small-interfering RNA (siRNA) treatments and conditions after 5-ethynyl-2′-deoxyuridine (EdU) incorporation (red, S phase) and staining with DAPI (4′,6-diamidino-2-phenylindole; white, nuclear mask). Scale bar, 50 µm. White arrow, flow direction. B, Quantification of EdU+ cells with indicated conditions. n=3 replicates, 5 images per condition per replicate. C through F, RT-qPCR (reverse transcription quantitative polymerase chain reaction) of flow cytometry–activated cell sorting (FACS)–sorted 24-hpf zebrafish endothelial cells from Tg(fli:LifeAct-GFP; green, endothelial cell marker) embryos of indicated genotypes for cdkn1bb ( C), mki67 ( D), pcna ( E), and ccnd1 ( F) levels. n=3 replicates. G, Representative images of 36-hpf Tg(fli:LifeAct-GFP; green, endothelial cell marker) embryos that were also WT or cdkn1bb−/−. Yellow arrows, ectopic sprouts. Scale bar, 50 µm. H, Quantification of ectopic sprouts per embryo. n=3 replicates, 5 images per condition per replicate. I, Diagram defining regions for ectopic sprout quantification in embryonic zebrafish. J, Quantification of % ectopic sprouts in Tg(fli:LifeAct-GFP; green, endothelial cell marker) embryos and of indicated genotypes per region. n=3 replicates, 5 images per condition per replicate. K, Representative images of 36-hpf Tg(fli:LifeAct-GFP) embryos injected with control (NT) or cdkn1bb MO at the 1-cell stage. Yellow arrows, ectopic sprouts. Scale bar, 50 µm. L, Quantification of ectopic sprouts per embryo. n=3 replicates, 5 images per condition per replicate. M, Quantification of % ectopic sprouts in Tg(fli:LifeAct-GFP; green, endothelial cell marker) and with indicated MO injection per region. n=3 replicates, 5 images per condition per replicate. Statistics, Student 2-tailed t test ( C through F, H, and L), 2-way ANOVA with Tukey multiple comparisons test ( B), and χ2 test ( J and M). NT indicates non-targeting; and WT, wild type. |

Endothelial quiescence depth varies with laminar flow exposure time and positively correlates with p27 expression levels. A, Representative images of human umbilical vein endothelial cell (HUVEC) with indicated conditions and stained for p27 (inhibitor), p21 (inhibitor), Ki67 (proliferation marker), and DAPI (4′,6-diamidino-2-phenylindole; nucleus) in white. Scale bar, 50 µm. White arrow, flow direction. B through D, Quantification of percent p27+ ( B), p21+ cells ( C), or Ki67+ cells ( D). n=3 replicates, 5 images per condition per replicate. E, Representative images of HUVEC under indicted conditions and after 5-ethynyl-2′-deoxyuridine (EdU) incorporation (red, S phase) and stained for phospho-retinoblastoma protein (pRB; blue, interphase) and with DAPI (4′,6-diamidino-2-phenylindole; white, nuclear mask), flow establishment (Flow-E; 15 d/cm2, 16 hours); flow maintenance (Flow-M; 15 d/cm2, 72 hours). Scale bar, 50 µm. White arrow, flow direction. F, Quantification of EdU+ cells under indicated conditions. n=3 replicates, 5 images per condition per replicate. G, Quantification of pRB+ cells under indicated conditions. n=3 replicates, 5 images per condition per replicate. H, Representative images of HUVEC with indicated siRNA treatments and conditions after EdU incorporation (red, S-phase) and staining with DAPI (white, nuclear mask). Scale bar, 50 µm. White arrow, flow direction. I, Quantification of EdU+ cells with indicated conditions. n=3 replicates, 5 images per condition per replicate. Statistics, 1-way ANOVA with Tukey multiple comparisons test ( B through D, F, and G) and 2-way ANOVA with Tukey multiple comparisons test ( I). NT indicates non-targeting; and siRNA, small interfering RNA. |
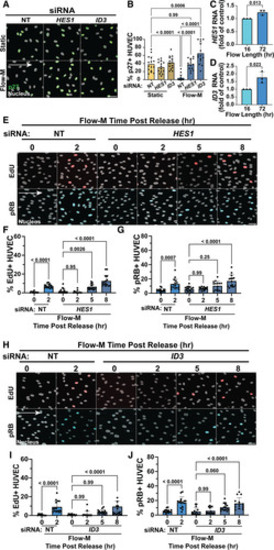
BMP- and NOTCH-regulated p27 repressors HES1 and ID3 regulate p27 levels and flow-mediated quiescence depth. A, Representative images of human umbilical vein endothelial cell (HUVEC) under indicated conditions and with indicated siRNA treatment. Cells stained for p27 (green) and DAPI (4′,6-diamidino-2-phenylindole; white, nuclear mask). Scale bar, 50 µm. White arrow, flow direction. B, Quantification of p27+ cells under indicated conditions and treatments. n=3 replicates, 5 images per condition per replicate. C and D, RT-qPCR for HES1 ( C) and ID3 ( D) levels under indicated conditions. n=3 replicates. E, Representative images of HUVEC under indicated conditions and siRNA treatments. Cells were labeled with 5-ethynyl-2′-deoxyuridine (EdU; red, S phase) and stained for pRB (blue, interphase) and DAPI (white, nuclear mask). Scale bar, 50 µm. White arrow, flow direction. F, Quantification of EdU+ cells with indicated conditions. n=3 replicates, 5 images per condition per replicate. G, Quantification of pRB+ cells with indicated conditions. n=3 replicates, 5 images per condition per replicate. H, Representative images of HUVEC under indicated conditions and siRNA treatments. Cells were labeled with EdU (red, S-phase) and stained for pRB (blue, interphase) and DAPI (white, nuclear mask). Scale bar, 50 µm. White arrow, flow direction. I, Quantification of EdU+ cells under indicated conditions. n=3 replicates, 5 images per condition per replicate. J, Quantification of pRB+ cells under indicated conditions. n=3 replicates, 5 images per condition per replicate. Statistics, Student 2-tailed t test ( C and D), 1-way ANOVA with Tukey multiple comparisons test ( F, G, I, J) and 2-way ANOVA with Tukey multiple comparisons test ( B). BMP indicates bone morphogentic protein; NOTCH, Notch signaling pathway; NT, non-targeting; pRB, phospho-retinoblastoma protein; RT-qPCR, reverse transcription quantitative polymerase chain reaction; and siRNA, small interfering RNA. |

Endothelial cells establish and maintain deep quiescence under venous flow and express elevated p27 levels in vivo. A, Representative images of human umbilical vein endothelial cell (HUVEC) under indicated conditions (flow maintenance, venous [Flow-MV; 5 d/cm2, 72 hours]) stained for p27 (green) and DAPI (4′,6-diamidino-2-phenylindole; white, nuclear mask). Scale bar, 50 µm. White arrow, flow direction. B, Quantification of HUVEC p27+ cells under indicated conditions, n=3 replicates, 5 images per condition per replicate. C, RT-qPCR for CDKN1B levels in indicated conditions. n=3 replicates. D, Representative images of HUVEC under static (nonflow) or Flow-EV (5 d/cm2, 16 hours) conditions with 5-ethynyl-2′-deoxyuridine (EdU) incorporation and fixation at indicated times post–Flow-EV release. Cells stained for DAPI (white, nuclear mask) and EdU (red, S phase), Scale bar, 50 µm. White arrow, flow direction. E, Quantification of EdU+ cells with indicated conditions. n=3 replicates, 5 images per condition per replicate. F, Representative images of HUVEC under static (nonflow) or Flow-MV conditions (5 d/cm2, 72 hours) with EdU incorporation and fixation at indicated times post–Flow-MV release. Cells stained for DAPI (white, nuclear mask) and EdU (red, S phase), Scale bar, 50 µm. White arrow, flow direction. G, Quantification of EdU+ cells with indicated conditions. n=3 replicates, 5 images per condition per replicate. H, UMAP grouping of artery, vein, and capillary endothelial cell clusters enriched from neonatal mouse ear skin. I, UMAP overlaid with Cdkn1b (p27) expression. J, Dot plot of Cdkn1b expression by endothelial subtype. K, UMAP grouping of endothelial artery, vein, and capillary clusters reanalyzed from 24-hpf embryonic zebrafish. L, UMAP overlaid with cdkn1bb (p27) expression. M, Dot plot of Cdkn1b expression by endothelial subtype. Statistics, Student 2-tailed t test ( B, C, J through M) and 1-way ANOVA with Tukey multiple comparisons test ( E and G). RT-qPCR indicates reverse transcription quantitative polymerase chain reaction; and UMAP, unifold manifold approximation and projection. |

Model of endothelial cell flow–mediated quiescence depth. Proposed model for dynamic regulation of endothelial cell flow–mediated quiescence depth with flow exposure time and magnitude. In the first 16 hours (arterial flow establishment [Flow-E]) of laminar flow, a deep quiescence is established accompanied by high levels of cell cycle inhibitor p27, independent of flow magnitude. With time under arterial flow (flow maintenance [Flow-M]), HES1 and ID3 transcription factors are upregulated downstream of flow-mediated Notch and BMP (bone morphogentic protein) signaling, and they repress p27 transcription leading to a shallow quiescence depth. Deep quiescence and high p27 levels characterize venous flow establishment at 16 hours (flow establishment, venous [Flow-EV]), and this deep quiescence perdures with time under venous flow (flow maintenance, venous [Flow-MV]). |