FIGURE SUMMARY
Title

Cold-induced FOXO1 nuclear transport aids cold survival and tissue storage

Authors
Zhang, X., Ge, L., Jin, G., Liu, Y., Yu, Q., Chen, W., Chen, L., Dong, T., Miyagishima, K.J., Shen, J., Yang, J., Lv, G., Xu, Y., Yang, Q., Ye, L., Yi, S., Li, H., Zhang, Q., Chen, G., Liu, W., Yang, Y., Li, W., Ou, J.
Source
Full text @ Nat. Commun.

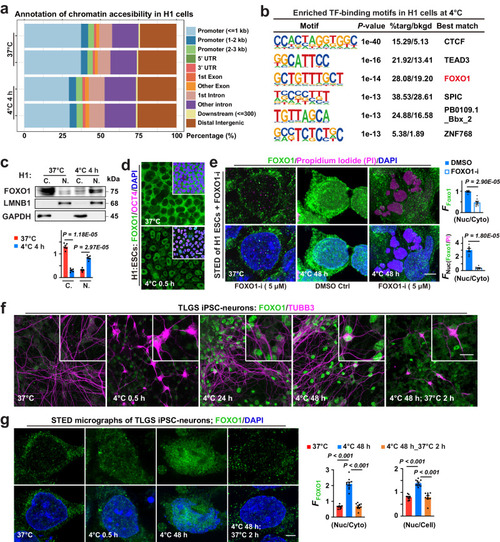
FOXO1 and cell cold adaptation.

a Stacked bar plots showing genomic annotation of chromatin accessible regions in different groups. b Binding motifs of transcription factors (TF) enriched in H1 cells following 4-h incubation at 4 °C. c Up: Immunoblots of FOXO1 proteins in cytosolic (C.) and nuclear (N.) fractions, conditions annotated; down: FOXO1 protein levels (n = 5 experiments). d Confocal images of FOXO1, pluripotency marker OCT4 and nuclear DNA (DAPI) staining in human embryonic stem cells (H1 ESCs) at indicated conditions (n = 10 experiments). e Left: Stimulated emission depletion (STED) micrographs detailing FOXO1, Propidium Iodide (PI; to stain dead cells) and DAPI signals in H1 cells at indicated conditions; right: Nuc FFOXO1 versus Cyto FFOXO1, or versus FPI (n = 7 and 8 experiments for DMSO and FOXO1-i, respectively); FOXO1-i, FOXO1 inhibitor. f Confocal images of FOXO1 and neuronal marker TUBB3 in TLGS iPSC-derived neurons at indicated conditions. g Left: STED images showing FOXO1 proteins and nuclear DNA (DAPI-stained) in TLGS iPSC-neurons at indicated conditions; right: the mean intensity of FOXO1 fluorescence (FFOXO1) in the nucleus (Nuc) versus that in the whole cell (Cell) or the cytosol (Cyto) was analyzed (from left to right, n = 10, 10, 9 images from 5 experiments). Data are shown as mean and SEM. Statistics: two-tailed Student’s t test (c, e) and one-way ANOVA followed by Tukey’s test (g). Scale bars: 20 μm (d, f) and 2.5 μm (e, g). Source data are provided as a Source Data file.

Temperature-induced differential FOXO1-DNA binding and transcriptomic changes in H1 ESCs.

a Left: fold change vs. -log10 FDR-corrected Q-value for differential FOXO1-binding at 37 °C or 4 °C 4 h in H1 ESCs revealed by CUT&Tag-seq; right: IGV (Integrative Genomics Viewer) snapshots showing FOXO1-binding signals around the DHX9 and EP300 loci (right); kb, kilobase pairs. b Line plots summarizing the mean of FOXO1 CUT&Tag signals within 3 kb up- and down-stream of gene transcription start sites (TSS) in H1 ESCs at 37 °C and 4 °C 4 h; kb, kilobase pairs. c Venn diagram indicating the overlap between differentially expressed genes (DEGs) upon rewarming and 4 °C-induced FOXO1 differentially bound genes in H1 ESCs. d Enrichment analysis on the overlapped genes from (c); left: Enrichment analysis on genes that had higher levels of transcripts at 4 °C 4 h compared to 4 °C 4 h_37 °C 2 h (rewarmed); right: Enrichment analysis on genes that had higher levels of transcripts at the rewarmed stage compared to 4 °C 4 h. P values in (d) were calculated in Metascape.

Temperature-mediated FOXO1 transport dependent on RANBP2, XPO1 and IPO7 SUMOylation.

a Left: Confocal images of H1 ESCs with annotated treatments; FOXO1, DAPI were co-stained with RANBP2, Importin-7 (IPO7) or Exportin-1 (XPO1); right: Nuclear FFOXO1 versus cytosolic or whole-cell FFOXO1 (n = 10, 10 and 12 images from 5 experiments for RANBP2, IPO7 and XPO1 RNA interference, respectively). b Confocal images of proximity ligation assay (PLA) on proteins of interest in H1 ESCs at indicated conditions. c Average counts of PLA puncta per cell from (b) (from left to right, n = 4, 4, 5, 7, 5 and 5 images from 3 experiments). d Up: immunoblots of XPO1, IPO7 and FOXO1 in total protein extracts (Input) and FOXO1 immunoprecipitated (IP-ed) fractions from H1 cells at annotated conditions; down: signal intensities normalized (n = 4 experiments). e Left: confocal images of PLA on proteins of interest in H1 ESCs at indicated conditions; right: average counts of PLA puncta per cell (from left to right, n = 4, 6, 6 and 6 experiments). f Up: immunoblots of XPO1 and IPO7 in Input and SUMO1 IP-ed fractions from H1 cells at annotated conditions; down: signal intensities normalized (n = 5 experiments). g Left: confocal images of PLA on FOXO1 interaction with endogenous IPO7 (n = 13 images from 3 experiments), or with overexpressed, HA-tagged IPO7 with a K-R mutation on its SUMOylation site in ARPE-19(WT) cells (n = 12 images from 3 experiments); WT, wild-type; right: average counts of PLA puncta per cell. Data are shown as mean and SEM. Statistics: one-way ANOVA followed by Tukey’s test (a, g) and two-tailed Student’s t test (cf). Scale bars: 20 μm (a, b, e) and 2.5 μm (g). Source data are provided as a Source Data file.

FOXO1 nuclear export determined by FOXO1 SUMO-interacting motif (SIM) and XPO1 SUMOylation

a Left: confocal images of FOXO1 and DAPI in ARPE-19(WT) and ARPE-19(FOXO1-minus SIM) at annotated conditions; right: FFOXO1 ratio analyzed (from left to right, n = 14, 12, 10 and 10 images from 5 experiments). b Up: Input and FOXO1 IP-ed fractions from ARPE-19(WT) and ARPE-19(FOXO1-minus SIM) cells at annotated conditions were immunoblotted against XPO1, IPO7 and FOXO1; down: signal intensities normalized (n = 5 experiments). c Left: confocal images of PLA on FOXO1 interaction with endogenous XPO1, or with overexpressed, HA-tagged XPO1 with both SUMOylation sites replaced with an arginine residue (K-R mutation) in ARPE-19(WT) and ARPE-19(FOXO1-minus SIM) cells at 37 °C (from left to right, n = 9, 7, 11 and 11 images from 3 experiments); right: average counts of PLA puncta per cell. d Confocal images of FLAG tag and DAPI staining in ARPE-19(WT) cells overexpressing FLAG-tagged, FOXO1 or mutant FOXO1 deleted of both NLS and NES domains (FOXO1-minus NLS/NES; in-frame deletion of amino acids 245-274 and 371-380) at annotated conditions (n = 3 experiments); NLS, nuclear localization sequence; NES, nuclear export signal. e Left: confocal images of PLA on indicated interacting pairs in ARPE-19(WT) cells overexpressing FLAG-tagged, FOXO1 or FOXO1-minus NLS/NES at annotated conditions; right: average counts of PLA puncta per cell (from left to right, n = 6, 8, 5, 7, 7, 7, 7 and 8 images from 3 experiments). Data are shown as mean and SEM. Statistics: one-way ANOVA followed by Tukey’s test (ac) and two-tailed Student’s t test (e). Scale bars: 20 μm. Source data are provided as a Source Data file.

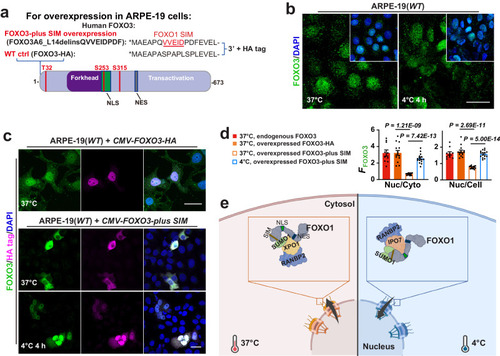
FOXO1 SIM as a Nuclear Exit Signal for FOXO3.

a Schema of FOXO3 mutant construct that contains the FOXO1 SIM. b Confocal images of FOXO3 and DAPI staining in ARPE-19(WT) cells at indicated conditions (n = 6 experiments). c Confocal images of FOXO3, HA tag and DAPI staining in ARPE-19 cells overexpressing FOXO3-plus SIM-HA at indicated conditions. dFFOXO3 ratio (from left to right, n = 10, 14, 15 and 15 images from 5 experiments). e A model for temperature and FOXO1 SIM-mediated FOXO1 transportation. The illustration was based on a template created with BioRender.com. Data are shown as mean and SEM. Statistics: two-tailed Student’s t test (d). Scale bars: 20 μm (b, c). Source data are provided as a Source Data file.

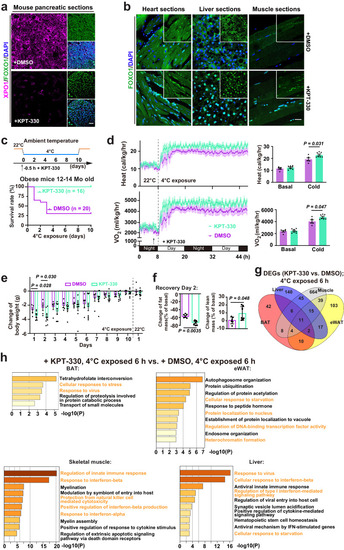
Activating FOXO1 nuclear entry to enhance cold survival in obese pre-diabetic mice.

a Confocal images of XPO1, FOXO1 and DAPI staining in obese mice (12-14 mo) pancreatic sections from indicated conditions (n = 5 mice from 5 experiments); KPT-330, XPO1 inhibitor. b Confocal images of FOXO1 and DAPI in obese mice heart, liver and skeletal muscle sections from indicated conditions (n = 5 mice from 5 experiments). c Survival rate of obese mice at indicated conditions; KPT-330, XPO1 inhibitor; DMSO is the solvent control. d Left: from a representative mouse energy expenditure experiment, heat and oxygen consumption (VO2) of obese mice with an intraperitoneal injection of KPT-330 (3 mg/kg) (n = 7) or DMSO (n = 5) prior to 4 °C exposure; right: average heat and VO2 under basal and cold-exposed conditions. e Daily changes of mouse body weight during 4 °C exposure (KPT-330, n = 9; DMSO, n = 5). f Mouse body mass composition following 10-day cold exposure at indicated conditions (KPT-330, n = 8; DMSO, n = 6). g Venn diagram showing the numbers of overlapped DEGs among indicated tissues from obese mice after 6 h of 4 °C exposure; also see Supplementary Data 3. h Enrichment analysis on DEGs upregulated in brown adipose tissues (BAT), epididymal white adipose tissues (eWAT), skeletal muscles and liver at indicated conditions. Data are shown as mean and SEM. Statistics: two-tailed Student’s t test (df); P values in (h) were calculated in Metascape. Scale bars: 20 μm (a, b). Source data are provided as a Source Data file.

Mouse pancreatic islet long-term storage and transplantation.

a Left: confocal images of FOXO1, PI and DAPI staining in mouse islets at indicated conditions; right: statistics on cell death percentage (from left to right, n = 14, 11 and 8 images from 3 experiments); UW, University of Wisconsin Solution; HS, basal hibernation solution used in cell cold exposure experiments. b Left: dead cell percentage in cold-stored mouse islets at annotated conditions (from left to right, n = 14, 9, 6, 8 and 16 images from 3 experiments); 2-D08 and ginkgolic acid are SUMOylation inhibitors added to HS; Ins1-Foxo1-KD, pancreatic β cell-specific knock-down of Foxo1; right: normalized levels of secreted and intracellular insulin in rewarmed islets as indicated (n = 3 experiments). Normalized islet oxygen consumption rate (OCR) from indicated conditions, as an assessment of islet quality following 24-h (fresh and UW: n = 7 experiments; KPT-330: n = 8 experiments) (c) or 2-h (n = 6 and 3 experiments for 7 and 14 d, respectively) (d) rewarming in vitro; K&P, KPT-330 and protease inhibitors. Glucose-stimulated insulin secretion assays with mouse islets from indicated conditions following 24-h (n = 6 experiments) (e) or 2-h (n = 5 experiments) (f) rewarming in vitro. g Blood glucose levels in Streptozotocin (STZ)-treated diabetic mice with cold-stored islets at indicated conditions (mice with sham transplantation: n = 3; transplanted with fresh islets: n = 5; n = 3 each for UW 7 or 10 d; n = 5 and 6 for HS + K&P 10 d and 14 d, respectively). h Representative image showing the transplanted islets (arrowheads), and confocal images of insulin, Glucagon and DAPI staining on kidney sections of the diabetic mice transplanted with islets stored at 4 °C in HS + K&P for 14 days (n = 6 mice), or with islets stored in UW solution at 4 °C for 5 days (n = 3 mice). Data are shown as mean and SEM. Statistics: one-way ANOVA followed by Tukey’s test (a, b) and two-tailed Student’s t test (bf). Scale bars: 20 μm (a, f). Source data are provided as a Source Data file.

Static cold storage of human pancreatic tissues and islets.

a Confocal images of FOXO1, insulin and DAPI staining in human pancreatic sections at indicated conditions (n = 9 donors). b Normalized levels of total insulin in human pancreatic tissues at annotated cold storage conditions (n = 3 samples from each of 9 donors). c GSIS assays with islets from human at indicated conditions (fresh ctrl: n = 6 donors; UW and K&P: n = 7 donors, respectively); K&P, KPT-330 and protease inhibitors. Data are shown as mean and SEM. Statistics: two-tailed Student’s t test (b, c). Scale bars: 20 μm (a). Source data are provided as a Source Data file.

Acknowledgments
This image is the copyrighted work of the attributed author or publisher, and ZFIN has permission only to display this image to its users. Additional permissions should be obtained from the applicable author or publisher of the image. Full text @ Nat. Commun.