
- Title
-
Genome editing of FTR42 improves zebrafish survival against virus infection by enhancing IFN immunity
- Authors
- Qu, Z.L., Gong, X.Y., An, L.L., Sun, H.Y., Guo, W.H., Luan, H.Y., Wu, M.Y., Dan, C., Gui, J.F., Zhang, Y.B.
- Source
- Full text @ iScience

ftr42-deficient zebrafish show increased resistance to SVCV infection (A and B) Scheme of the genomic structure shows CRISPR/Cas9-targeted site in exon 1 of zebrafish FTR42, causing a reading frameshift due to 1-bp insertion and 1-bp mutation (A), which was verified by sequencing (B). (C) Representative images showed WT and ftr42lof/lof zebrafish larvae (4 dpf, n = 50 per group) immersed with SVCV (5×10⁶ TCID50/mL) for 48h. Dead larvae showed obvious body curling. (D) Survival ratios of WT and ftr42lof/lof zebrafish larvae (n = 100 per group) were counted at indicated time points after immersion challenge with SVCV (5×10⁶ TCID50/mL). (E) Representative images showed the hemorrhagic comparison of WT and ftr42lof/lof zebrafish adults (90 dpf) that were i.p. injected for 48h with SVCV (1×10⁸ TCID50/mL), 20 μL per fish. (F) Survival ratios of WT and ftr42lof/lof zebrafish adults (n = 30 per group) were counted at indicated time points after injection challenge with SVCV (1×10⁸ TCID50/mL). (G and H) FTR42 deficiency impaired SVCV replication in zebrafish larvae (G) and adults (H) following SVCV infection. WT and ftr42lof/lof zebrafish larvae (4 dpf) or adults (90 dpf) were challenged with SVCV as in (D) and (F), respectively. At indicated times, SVCV genes, including nucleoprotein (N), RNA polymerase (L), glycoprotein (G), matrix protein (M) and phosphoprotein (P) were detected by RT-qPCR. Zebrafish survival curves were analyzed by Log-Rank test. Data were shown as mean ± SD (N = 3). p values were calculated using Student’s t test. ∗∗p < 0.01, ∗∗∗p < 0.001. |
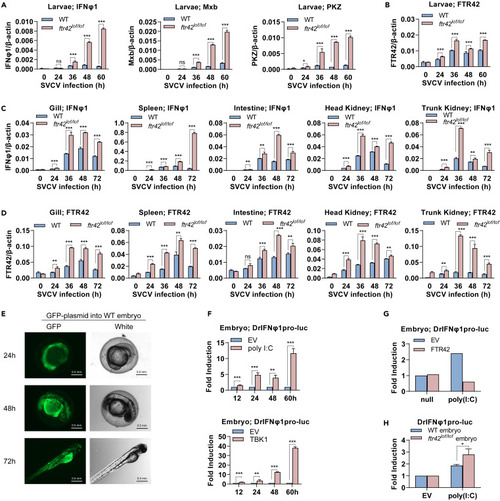
. FTR42-deficient zebrafish show an enhanced IFN immunity (A and B) FTR42-deficient zebrafish larvae showed an enhanced IFN immunity. WT and ftr42lof/lof larvae (4 dpf) were immersed with SVCV (5×10⁶ TCID50/mL) for indicated time points, followed by RT-qPCR analyses of ifnφ1, mxb and pkz (A) and ftr42 (B). (C and D) FTR42-deficient zebrafish adults showed an enhanced IFN immunity. WT and ftr42loflof adults (90 dpf) were i.p. injected with SVCV (1×10⁸ TCID50/mL) for indicated time points, followed by RT-qPCR analyses of ifnφ1 (C) and ftr42 (D) in various tissues. (E) GFP was continuously expressed in zebrafish embryos by microinjection. A GFP plasmid (60 pg/nL) was microinjected into one-cell-stage zebrafish embryos (1 nL per embryo), followed by fluorescence microscopy at indicated time points. Scale bar: 0.5 mm. (F) IFNφ1 promoter was activated in zebrafish embryos by poly(I:C) or TBK1. One-cell-stage embryos were microinjected with DrIFNφ1pro-luc (50 pg/nL) and pRL-TK (2.5 pg/nL), together with poly(I:C) (50 pg/nL) or TBK1 (50 pg/nL), in a total volume of 1 nL per embryo. At the indicated time points, embryos were collected for luciferase assays. (G and H) IFNφ1 promoter activation was inhibited in zebrafish embryos by FTR42. One-cell-stage WT embryos were microinjected as in (F) with DrIFNφ1pro-luc, poly(I:C) and FTR42 (50 pg/nL), together with pRL-TK (2.5 pg/nL) (G). Or WT and ftr42lof/lof embryos were injected with DrIFNφ1pro-luc, poly(I:C) and pRL-TK, respectively (H). 60 h later, luciferase assays were performed. Data were shown as mean ± SD (N = 3). p values were calculated using Student’s t test. ∗p < 0.05, ∗∗p < 0.01, ∗∗∗p < 0.001. |

FTR42 impairs IFN response by attenuating TBK1 protein level in vitro (A) Overexpression of FTR42 inhibited IFN promoter activation by MAVS, MITA, TBK1 and IRF7 but not by IRF3. CAB cells seeded in 48-well plates overnight were transfected with DrIFNφ1pro-luc, each of signaling molecules (MAVS, MITA, TBK1, IRF3 and IRF7) or empty vector as control (100 ng each), together with FTR42 at increasing amounts. 10 ng pRL-TK was included as internal control. 30 h later, cells were harvested for luciferase assays. (B–D) FTR42 downregulated TBK1-trigged IFN response. EPC cells seeded in 6-well plates were transfected with the indicated plasmids as in (A), and were then collected at the indicated time points (B and C) or at 30 h post transfection (D), for RT-qPCR analyses of mRNA expression of cellular ifn and ISGs (B and D), and mRNA expression from the transfected FTR42-vt and TBK1-vt (C and D). (E and F) FTR42 attenuated TBK1 protein levels in vitro. EPC cells seeded in 3.5 cm2 dishes overnight were transfected with TBK1, FTR42 or pcDNA3.1 as control (1 μg each), and at different time points, the cells were harvested for western blotting analyses (E). Or the cells were transfected for 30 h with TBK1 and FTR42 at the indicated doses, followed by western blotting (F). Data were shown as mean ± SD (N = 3). p values were calculated using Student’s t test. ∗∗∗p < 0.001. |
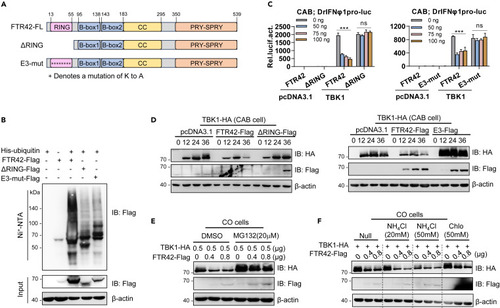
FTR42 inhibits TBK1-triggered IFN response dependent on its E3 ligase activity (A) Schematic diagrams of full-length FTR42, ΔRING and E3-mut. (B) FTR42 but not ΔRING or E3-mut possessed the E3 ligase activity. HEK293T cells seeded in 10 cm2 dishes were transfected with His-Ub, together with FTR42-Flag or ΔRING-Flag or E3-mut-Flag (5 μg each). 30 h later, the cells were lysed and incubated with Ni2-NTA overnight, followed by western blotting to determine the ubiquitination of FTR42 and two mutants. (C) FTR42-ΔRING or E3-mut failed to inhibit TBK1-triggered IFNφ1 promoter activation. CAB cells seeded in 48-well plates overnight were transfected with DrIFNφ1pro-luc, TBK1 or empty vector (100 ng each), together with FTR42 or ΔRING or E3-mut at increasing amounts. 30 h later, the cells were harvested for luciferase assays. (D) FTR42-ΔRING or E3-mut failed to attenuate TBK1 protein level in vitro. CAB cells seeded in 3.5 cm2 dishes were co-transfected with the indicated plasmids (1 μg each) for 30 h, followed by western blotting assays with tag-specific Abs. (E and F) FTR42-triggered TBK1 degradation was blocked by MG132 but not by NH4Cl or chloroquine. CO cells seeded in 12-well plates were co-transfected with indicated plasmids for 24 h, followed by treatment with MG132, NH4Cl, or chloroquine for additional 6 h. p values were calculated using Student’s t test. ∗∗∗p < 0.001; ns, not significant. |

FTR42 impairs IFN response by attenuating TBK1 protein level in vivo (A and B) FTR42-dificient zebrafish showed an enhanced expression of ifnφ1 mRNA over WT zebrafish but a constant tbk1 mRNA expression in response to SVCV infection. Zebrafish adults (90 dpf, A) and zebrafish larvae (4 dpf, B) were challenged with SVCV. At the indicated time points, tissues or larvae were sampled for RT-qPCR analyses of cellular ifnφ1 and tbk1 mRNA. (C and D) FTR42-dificient zebrafish showed a higher level of TBK1 protein than WT zebrafish upon SVCV infection. Zebrafish larvae (C) and adults (D) were infected with SVCV. At the indicated time points, larvae or gill were sampled for western blotting analyses of endogenous TBK1 protein. (E) TBK1 activated IFN promoter more significantly in ftr42lof/lof embryos than in WT embryos. One-cell-stage embryos from WT and FTR42-dificient zebrafish were microinjected with TBK1 (50 pg), DrIFNφ1pro-luc (50 pg) and pRL-TK (2.5 pg), in a volume of 1 nL per embryo. At 48 h or 60 h post injection, the embryos were collected for luciferase assays. (F) TBK1 induced transcriptional expression of ifnφ1 and mxb more significantly in ftr42lof/lof embryos than in WT embryos. One-cell-stage embryos were microinjected with TBK1(60 pg), in a volume of 1 nL per embryo. 48 h later, ifnφ1 and tbk1 mRNA was detected by RT-qPCR. (G) A constant expression of tbk1 mRNA was detected in ftr42lof/lof and WT embryos after microinjection. The same samples in (F) were used to detect mRNA expression from the injected TBK1 plasmid by RT-qPCR. Data were shown as mean ± SD (N = 3). p values were calculated using Student’s t test. ∗∗p < 0.01, ∗∗∗p < 0.001; ns, not significant. |

FTR42 facilitates IRF7 mRNA decay to downregulate IFN response in vitro (A–C) FTR42 attenuated IRF7 protein levels independently of protein degradation. CAB cells seeded in 3.5 cm2 dishes overnight were transfected with IRF7, together with FTR42 (1 μg ecah) for different time points (A) or with FTR42 at increasing amounts (B) for 30 h; or CAB cells seeded in 12-well plates were transfected for 24 h with FTR42 and IRF7 (0.5 μg each), followed by treatment with MG132, NH4Cl, or chloroquine for additional 6 h (C). (D–F) FTR42 downregulated IRF7-trigged IFN response by attenuating IRF7 transcription. CAB cells seeded in 3.5 cm2 dishes were transfected with IRF7 and FTR42 (1 μg each) for different time points (D and E), or CAB cells seeded in 6-well plates were transfected for 24 h with IRF7 (0.5 μg) and FTR42 at increasing amounts (F), followed by RT-qPCR detection of mRNA expression from the transfected FTR42 and IRF7 plasmid (D and F), or from cellular ifn, mx and viperin (E and F). (G) FTR42-mediated reduction of IRF7 protein was blocked by CHX. CAB cells seeded in 12-well plates overnight were transfected for 24 h with IRF7 (0.5 μg) and FTR42 at increasing doses (0, 0.2, 0.4, 0.8 μg), followed by addition of CHX or DMSO as control. Another 6 h later, the cells were collected for western blotting (left panel), followed by densitometric quantification of IRF7 protein expression normalized to β-actin (right panel). (H) FTR42-mediated reduction of IRF7 mRNA was not impaired by ActD. CAB cells seeded in 12-well plates overnight were transfected as (F). 24 h later, ActD (1 μg/mL) was added to the plates for 4 h or 7 h, followed by RT-qPCR detection of mRNA from the transfected IRF7 plasmid. Data were shown as mean ± SD (N = 3). p values were calculated using Student’s t test. ∗∗p < 0.01, ∗∗∗p < 0.001. |
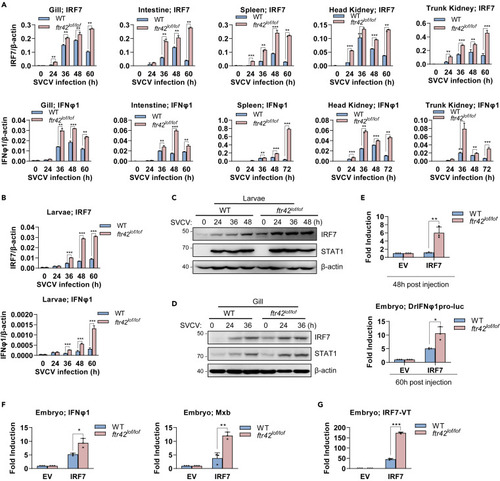
FTR42 facilitates IRF7 mRNA decay to downregulate IFN response in vivo (A and B) FTR42-dificient zebrafish showed enhanced mRNA expression of irf7 and ifnφ1 over WT zebrafish upon SVCV infection. Zebrafish adults (90 dpf, A) and zebrafish larvae (4 dpf, B) were challenged with SVCV. At the indicated time points, tissues or larvae were sampled for RT-qPCR analyses of cellular ifnφ1 and irf7. (C and D) FTR42-dificient zebrafish showed a higher level of IRF7 protein than WT zebrafish upon SVCV infection. Zebrafish larvae (C) and adults (D) were infected with SVCV. At the indicated time points, larvae or gill were sampled for western blotting analyses of endogenous IRF7 protein. (E) IRF7 stimulated IFN promoter activation more significantly in ftr42lof/lof embryos than in WT embryos. One-cell-stage embryos from WT and FTR42-dificient zebrafish were microinjected with IRF7 (50 pg), DrIFNφ1pro-luc (50 pg) and pRL-TK (2.5 pg), in a volume of 1 nL per embryo. At the indicated time points, the embryos were collected for luciferase assays. (F) IRF7 induced transcriptional expression of ifnφ1 and mxb more significantly in ftr42lof/lof embryos than in WT embryos. One-cell-stage embryos were microinjected with IRF7 (60 pg), in a volume of 1 nL per embryo. 48 h later, ifnφ1 and mxb mRNA was detected by RT-qPCR. (G) FTR42-dificient zebrafish expressed a higher level of IRF7 mRNA than WT zebrafish after microinjection. The same samples in (F) were used to detect irf7 mRNA from the microinjected IRF7 plasmid by RT-qPCR. Data were shown as mean ± SD (N = 3). p values were calculated using Student’s t test. ∗p < 0.05, ∗∗p < 0.01, ∗∗∗p < 0.001. |

FTR42 but not E3-mut reduces the susceptibility of ftr42lof/lof zebrafish to SVCV infection (A) Representative images of WT and ftr42lof/lof zebrafish larvae (4 dpf, n = 50 per group) after SVCV immersion challenge (5×10⁶ TCID50/mL) for 36 h. zebrafish larvae were raised from embryos that had been microinjected at one cell stage with FTR42 or E3-mut or empty vector (60 pg each) in a volume of 1 nL. (B) Survival ratios were calculated by counting deaths of WT and ftr42lof/lof zebrafish larvae (n = 50 per group), which were developed from embryos through microinjection and subsequently immersed with SVCV as in (A). (C–E) Transcriptional expression of ifnφ1 and mxb (C), irf7 and tbk1 (D), and five SVCV genes (E) were compared between WT and ftr42lof/lof zebrafish larvae, which were developed from embryos through microinjection and subsequently immersed for 48 h with SVCV as in (A). Zebrafish survival curves were analyzed by Log-Rank test. Data were shown as mean ± SD (N = 3). p values were calculated using two-way ANOVA analysis. ∗p < 0.05, ∗∗p < 0.01, ∗∗∗p < 0.001; ns, not significant. |