- Title
-
Non-invasive single cell aptasensing in live cells and animals
- Authors
- Osman, E.A., Rynes, T.P., Wang, Y.L., Mruk, K., McKeague, M.
- Source
- Full text @ Chem Sci
|
DIVE platform controls in HEK293T cells and zebrafish embryos. (A) Workflow of the cell assay. (B) Fluorescence measurements for each control: no transfection, the core plasmid pDIVE containing only GFP and mCherry, the DIVE.OFF negative control, and DIVE.ON positive control. GFP and mCherry fluorescence is measured for each cell population. The relative GFP/mCherry ratio is calculated and plotted. Data are the mean and standard deviation of three independent experiments each with technical triplicates. (C) The workflow for testing activity of the DIVE system in zebrafish embryos. WT embryos were injected at the one-cell stage and raised until 1 day post fertilization (dpf). (D) Epifluorescence micrographs from an entire clutch are shown for embryos. (E) Three random embryos from each injection condition were imaged and pixel intensity across the trunk quantified. Embryos lacking the mCherry expression control are not included as this indicates either they were not integrated into the genome or in a region with silent expression. The average GFP/mCherry ratio ± s.d. was plotted. Values for individual fish are shown. |
|
Comparison of DIVE aptasensors for six drugs. GFP/mCherry ratio for each DIVE aptasensor in HEK293T cells in the presence and absence of its corresponding drug: DIVE_1 with 100 μM aciclovir; DIVE_2 with 1 mM folinic acid; DIVE_3 with 50 μM gardiquimod; DIVE_4 with 2 mM neomycin; DIVE_5 with 500 μM tetracycline; and DIVE_6 with 1 mM theophylline. Data are the mean and standard deviation of three independent experiments each with technical replicates. p values from a two-tailed, unpaired t-test with Welch's correction. Significance summary: p > 0.05 (ns), p ≤ 0.05 (*), p ≤ 0.01 (**), p ≤ 0.0001 (****). |
|
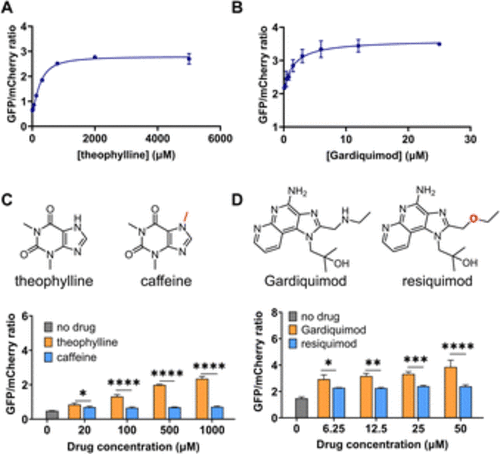
DIVE aptasensor performance: dose response and specificity. GFP/mCherry ratios after incubating HEK293T cells with increasing concentrations of their corresponding drugs (A) DIVE_6. (B) DIVE_3. (C) DIVE_6 specificity in the presence of theophylline and caffeine. (D) DIVE_3 specificity in the presence of gardiquimod and resiquimod. Data are the mean and standard deviation of three independent biological experiments. p values from a 2-way ANOVA with Šídák's multiple comparisons test indicated. Significance summary: p ≤ 0.05 (*), p ≤ 0.01 (**), p ≤ 0.001 (***), p ≤ 0.0001 (****). |
|
Live-cell imaging of drug uptake using DIVE aptasensors. (A) HEK293T cells expressing DIVE.OFF and DIVE.ON controls. (B) HEK293T cells expressing DIVE_6 and treated with theophylline. (C) HEK293T cells expressing the DIVE_6 biosensor treated with caffeine. Scale bars: 100 μm. Results are from one experiment; two additional independent experiments were performed (Fig. S8†). |
|
Non-invasive imaging of drug uptake in new transgenic DIVE expressing zebrafish line. (A) Workflow for generating DIVE aptasensor-expressing transgenic zebrafish Tg(Ubi:GFP-DIVE_6; Ubi:mCherry). Embryos from an F2 outcross were bathed in 1 mM theophylline beginning at 24 hpf. (B) Representative brightfield and fluorescent micrographs from 48 hpf embryos containing the integrated biosensor plasmid (Ubi:GFP-DIVE_6; Ubi:mCherry). Zebrafish orientation is lateral view, anterior left. Scale bar: 250 μm. (C) Quantification of pixel intensity of GFP and mCherry was calculated for the trunk of the zebrafish and the GFP/mCherry ratio plotted. The average GFP/mCherry ratio ± s.d. with values for individual fish shown. p values from a Kruskal–Wallis analysis of variance with post-hoc Dunn's test. |
|
Washout of theophylline in transgenic DIVE expressing zebrafish line. Representative brightfield and fluorescent micrographs from embryos containing the integrated biosensor plasmid (Ubi:GFP-DIVE_6; Ubi:mCherry) and bathed for 24 hours in 1 mM theophylline. Embryos were measured after removal of theophylline. Zebrafish orientation is lateral view, anterior left. Scale bar: 250 μm. Graph displays quantification of pixel intensity calculated for the trunk of the zebrafish with the GFP/mCherry ratio plotted. The average GFP/mCherry ratio ± s.d. with values for individual fish shown. |


