FIGURE SUMMARY
Title

The level of protein in the maternal murine diet modulates the facial appearance of the offspring via mTORC1 signaling

Authors
Xie, M., Kaiser, M., Gershtein, Y., Schnyder, D., Deviatiiarov, R., Gazizova, G., Shagimardanova, E., Zikmund, T., Kerckhofs, G., Ivashkin, E., Batkovskyte, D., Newton, P.T., Andersson, O., Fried, K., Gusev, O., Zeberg, H., Kaiser, J., Adameyko, I., Chagin, A.S.
Source
Full text @ Nat. Commun.

Active enhancers in human embryonic tissue associated with facial individuality.

A Experimental layout: embryonic human facial mesenchyme was collected and CAGE-sequenced to identify transcribed enhancers, which were subsequently compared to SNPs associated with facial morphology within the normal range as indicated by genome-wide association sequencing (GWAS). B Distribution of the genes located proximally to the enhancers identified in relationship to the GWAS probability. Genes related to the PI3K/AKT/mTORC1/autophagy pathway are highlighted in red. C Illustration of the PI3K/AKT/mTORC1/autophagy pathway (based on refs. 29 and 17 and the Autophagy database http://www.tanpaku.org/autophagy/) highlighting the genes identified. D Protein interaction network generated by the STRING database for the genes related to the development of individual facial features. The six genes indicated in B are highlighted in red. The thickness of the connecting lines reflects the strength of interactions. E Distribution of the individual facial phenotypes revealed by GWAS to be associated with each of the six genes encoding components of the PI3K/AKT/mTORC1/autophagy pathway.

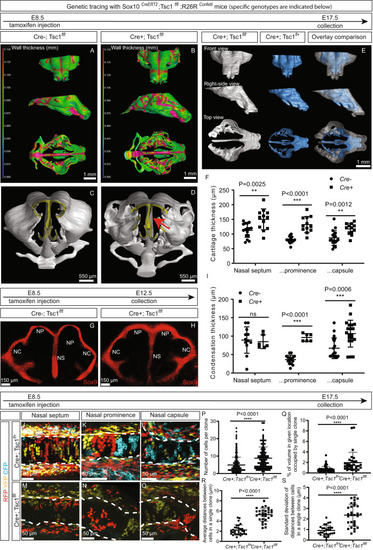
Activation of the mTORC1 pathway in the neural crest cells of mice results in thickening of the nasal cartilage, mesenchymal condensations, and the formation of bulky clonal clusters.

AD The mTORC1 pathway in Sox10CreERT2;Tsc1fl/fl;R26RConfetti mice was activated by ablation of Tsc1 through exposure to tamoxifen on E8.5. 3D reconstruction of the entire chondrocranium on the basis of µCT with enhancement by PTA allowed comparison of the thickness of various structures in control A, C and Tsc1cKOB, D mice. The surface of the skeletal structures as revealed by these reconstructions in control and Tsc1cKO mice are shown in C, D. The arrow in D points toward the curved nasal septum. E Overlay of 3D-reconstructions revealed differences in the size and shape of the chondrocranium in control and Tsc1cKO mice. F Quantification of thickness of the cartilage in the three major nasal compartments. n = 12 animals. GH Representative images of chondrogenic condensations (revealed by SOX9 staining on E12.5) in control G and Tsc1 cKO H mice. I Quantification of the condensation thickness of the three major nasal compartments. n = 12 animals. JO Clonal arrangements in facial cartilage on E17.5 in the presence of one (J-L, control) or no MO copy of theTsc1 gene (Tsc1cKO) are depicted. The images shown are representative for the three major types of nasal cartilage—the septum J, M, prominence K, N, and capsule L, O. PS Clones within cartilage were characterized with respect to the number of cells per clone P, volume occupied by each clone Q, average distance between cells within each clone R, and dispersion of the clones as reflected in the standard deviation of distances between cells S. Between 30 and 249 clones obtained from 3 animals were quantified PS. Means ± SD are presented for all quantification graphs. Two-sided student’s unpaired t-test was applied to the values in F, I, P, Q, R, S. Source data are provided as a Source Data file.

Modulating mTORC1 activity at the stage of intercalation alters craniofacial shape and the size of chondrocyte clones to a minor extent.

All mice were pulsed with tamoxifen on E12.5 and analyzed on E17.5. AJ The mTORC1 pathway was activated by ablation of Tsc1 in chondroprogenitors employing Sox10CreERT2;Tsc1fl/fl;R26RConfetti mice. The images shown are representative for the three major types of nasal cartilage - the septum A, D, prominence B, E and capsule C, F. Clones within cartilage were characterized with respect to the number of cells per clone G, volume occupied by each clone H, average distance between cells within each clone I, and dispersion of the clones as reflected in the standard deviation of distances between the cells in each clone J. n = 3 animals for GJ. KO The mTORC1 pathway was activated in chondroprogenitors by ablation of Tsc1 employing Collagen type 2-driven CreERT recombinase (Col2CreERT;Tsc1fl/fl;R26RConfetti). Representative sagittal sections stained with HE K, L, clonal appearance M, N and quantification of clonal size O revealed little difference between the heads of control (Cre + ;Tsc1fl+;R26RConfetti) K, M and Tsc1 cKO (Cre + ;Tsc1fl/fl;R26RConfetti) L, N embryos. n = 2 animals in O. PR The mTORC1 pathway was inactivated in chondroprogenitors by ablation of the Raptor gene employing Collagen type 2-driven CreERT recombinase (Col2CreERT;Raptorfl/fl). Reconstruction of cartilaginous and bony structures in the heads of (P) control (Cre-negative, Raptorfl/fl) and QRaptor cKO (Col2CreERT;Raptorfl/fl) mice was examined by μCT enhanced with Hexabrix. The green line indicating nasal length was quantified R. n = 2 and 4 animals in R. SY Clonal reporter R26RConfetti was bred into Col2CreERT;Raptorfl/fl mice (Col2CreERT;Raptorfl/fl;R26RConfetti) and clonal appearance assessed in the nasal septum S, V, nasal prominence T, W and nasal capsule U, X. The number of cells per clone was quantified Y. 118 and 336 clones were quantified in Y. Means ± SD are presented for all quantification graphs, with individual values also indicated and determination of statistical significance using the two-sided unpaired t-test. Source data are provided as a Source Data file.

Inhibition of mTORC1 at various stages of embryonic development modulates the shape of craniofacial structures in both mice and zebrafish.

AC Pregnant C57BL/6 J dams were exposed to a single dose of either DMSO or rapamycin on E10.5 and stained with hematoxylin-eosin on E17.5. Representative images of the general appearance A or sagittal sections of their heads B, C are shown. DF Embryos were treated as in A, but stained for SOX9 on E12.5 to reveal chondrogenic condensations D, E, the thickness of which in the three major nasal compartments was quantified in F. n = 4 or 6 animals in F. GM The same treatment as in A was applied to Col2CreERT;R26RConfetti mice pulsed with tamoxifen on E12.5 and E13.5 and clonal appearance analyzed on E17.5 GL and clonal size quantified M. 685 and 1133 clones obtained from 3 animals were quantified in M. NSCol2a1aBAC:mcherry zebrafish larvae were exposed to DMSO or rapamycin at various periods in development. Ventral N, O and lateral P, Q views of the larvae exposed to DMSO N, P or rapamycin O, Q 14–22 h post-fertilization (hpf) and imaged at 120 hpf are shown. The facial length R and width P of 120-hpf-old Col2a1aBAC:mcherry zebrafish larvae exposed to rapamycin during the intervals of time indicated were quantified. n = 3–9 animals in R, S. Means ± SD are presented, with individual values also indicated. The two-sided unpaired t-test was employed to compare the values in F, M, and one-way ANOVA followed by Dunnett’s multiple comparisons test in R and S. Source data are provided as a Source Data file.

The level of protein in the maternal diet alters the structure of the facial skeleton of their embryos.

AF Genetically identical wild-type pregnant C57BL/6 J dams consumed isocaloric diets containing different levels of protein (4%, 20% (standard chow=22%), 40%) from E6.5 of pregnancy and on E17.5 the skeleton in the heads of their embryos was reconstructed employing µCT with PTA enhancement A. The following parameters indicated in A were measured: the thickness (1) and length (2) of the nasal capsule, the thickness (3) and length (4) of the entire chondrocranium, and the length of the right (5) and left (6) portions of the Meckel cartilage. The thickness B and length C of the nasal capsule and the average length of the Meckel cartilage D are shown. Overlayed 3D reconstructions E and the thickness of craniofacial structures F from embryos whose mothers consumed diets containing different levels of protein are presented for direct comparison. n = 12 and 13 animals in BD. GJ Pregnant Sox10CreERT2;Tsc1fl/fl dams consumed isocaloric diets containing either 4% or 40% protein from E6.5 of pregnancy and Tsc1 was ablated in the neural crest cells of their embryos by pulsing with tamoxifen on E8.5. The skeleton in the heads of their embryos was reconstructed on day E17.5 employing µCT with PTA enhancement G. Quantification of the width H and length I of the nasal capsule and the average length of the Meckel cartilage J are depicted. n = 6 or 7 animals in HJ. K, L The same diets as in A-F were administered to pregnant Col2CreERT;R26RConfetti dams pulsed with tamoxifen on E12.5 and E13.5. Representative images of clonal appearance K and quantification of clonal size L in the entire nasal cartilage are shown. n = 4 and 5 animals in L. Means ± SD are presented, with individual values also indicated. One-way ANOVA followed by Tukey’s multiple comparisons test was employed to compare the values in BD and L, and the two-sided unpaired t-test in HJ. The white dashed lines in K outline the cartilage. Source data are provided as a Source Data file.

Acknowledgments
This image is the copyrighted work of the attributed author or publisher, and ZFIN has permission only to display this image to its users. Additional permissions should be obtained from the applicable author or publisher of the image. Full text @ Nat. Commun.