FIGURE SUMMARY
Title

Direct male development in chromosomally ZZ zebrafish

Authors
Wilson, C.A., Batzel, P., Postlethwait, J.H.
Source
Full text @ Front Cell Dev Biol

Sex ratios and gonad histology in adult ZW and ZZ zebrafish at 5 months post fertilization (mpf). (A) Sex phenotypes in progeny of ZW females crossed to ZZ males. Within each sex genotype, each point represents a different cross. No ZZ individuals became adult females. (B) Sex phenotypes in progeny of ZW females crossed to ZW neomales. No ZZ individuals became adult females. C-G. Cross sections of 5mpf adult gonads. (C) ZZ adult testis. (D) ZW ovary. (E) ZW neomale testis. (F) WW ovary. (G) WW neomale testis. Ovary histology for ZW and WW fish showed no clear difference and testis histology of ZZ, ZW, and WW fish was the same. Abbreviations: o, oocyte; pc, pycnotic cell; sc, spermatocyte; sg, spermatogonium; sp, spermatid; sz, spermatozoa.

Developmental trajectory of gonads from ZW and ZZ fish. (A,C,E,G,I,K,M,N) ZW gonads. (B,D,F,H,J,L): ZZ gonads. (A,B) 10dpf. (C,D) 14dpf. (E,F) 19dpf. (G,H) 22dpf. (I,J) 26dpf. (K,L)30dpf. At 19dpf and earlier, ZW and ZZ gonads were histologically similar, but at 22dpf and later, oocytes were developing in ZW, but not ZZ gonads. At 26dpf, some ZZ gonads showed clusters of spermatogonia, and at 30dpf, most ZZ gonads were still immature testes that were organized into cysts containing spermatogonia and spermatocytes. No ZZ gonad studied showed any oocytes at any developmental stage, but instead, showed direct development into testes. (M) At 26dpf, some ZW gonads were mostly ovary with a few pycnotic cells. (N) At 30dpf, some ZW gonads were mostly testes with a few pycnotic cells. Abbreviations: *, gonocytes; g, gonad; I and II, Stage I and Stage II oocytes; in, intestine; li, liver; o, oocyte; pc, pycnotic cell; sc, spermatocyte; sg, spermatogonium.

Cell-type marker genes for 19dpf ZW and ZZ gonads. (A) UMAP plot for 19dpf gonads combining ZW and ZZ cells. (B) Cells originating from ZW (red) or ZZ (blue) gonads, showing all clusters with mixtures of both sex genotypes. (C,D) Germ cells marked by dazl and ddx4 (vasa) were in cluster 19c17. (E,F) Support cells (granulosa and Sertoli) or their precursors marked by gsdf, and lhx9. (G,H) Steriogenic cells (theca, Leydig) or their precursors labeled with inhbaa and robo2 expression. (I,J) Stroma/interstitial cells marked by col1a1a and pcolcea. (K) White blood cells identified by coro1a expression. (L) Vasculature labeled with si:dkeyp-97a10.2. Abbreviations: g, germ cells; si, stroma/interstitial; sd, steroidogenic; su, support; v, vascular; w, white blood cells.

Cell-type marker genes for 30dpf ZW and ZZ gonads. (A) UMAP plot for 30dpf gonads combining ZW and ZZ cells. (B) Cells originating from ZW (gold) or ZZ (blue) gonads, showing several clusters with sex-specific genotypes. (C,D). Germ cells marked by dazl and ddx4 (vasa) expression. (E,F). Support cells (granulosa and Sertoli) or their precursors marked by gsdf and lhx9 expression. (G,H). Steriogenic cells (theca, Leydig) or their precursors labeled with inhbaa and nr5a1b expression. (I,J). Stroma/interstitial cells marked by col1a1a and pcolcea expresseion. (K) White blood cells identified by coro1a expression. (L) Vasculature labeled with si:dkeyp-97a10.2 expression. Abbreviations: g, germ cells; oo, oocytes; si, stroma/interstitial; sd, steroidogenic; su, support; v, vascular; w, white blood cells.

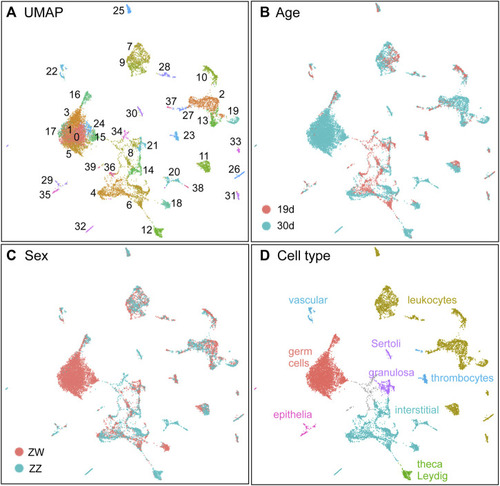
The combined dataset with two ages, each with two sex genotypes. (A) UMAP displaying clusters. (B) Samples displayed by age (19dpf, red; 30dpf, blue). (C) Samples displayed by sex genotype (ZW, red; ZZ, blue). (D) Inferred cell types.

Germ cell development in the merged analysis of both ZW and ZZ cells at both 19 and 30dpf. (A) UMAP isolating germ cell clusters. (B) Germ cells marked by age (red, 19dpf; blue, 30dpf). (C) Germ cells marked by sex genotype (red, ZW; blue, ZZ). (D)ddx4(vasa) including all four conditions. (E)ddx4 showing only ZW cells at 19dpf. Insert in lower left of the panel shows ddx4 expression in the ZW germ cell cluster 19c17 in the analysis of 19dpf cells only (see Figure 3). (F)ddx4, only ZW cells at 30dpf. (G)ddx4, only ZZ cells at 19dpf. Insert in lower left of the panel shows ddx4 expression in the ZZ germ cell cluster 19c17 from the analysis of 19dpf cells only. (H)ddx4, only ZZ cells at 30dpf. (I)dnd1 ZW cells only at both 19dpf and 30dpf. (J)dnd1 ZZ cells only at both 19dpf and 30dpf. (K)fkbp6, both ZW and ZZ cells only at 19dpf. (L)fkbp6, both ZW and ZZ cells only at 30dpf. (M)piwil2, ZW and ZZ cells at 19dpf. (N)piwil2, ZW and ZZ cells at 30dpf. (O)bmp15, ZW cells at both 19dpf and 30dpf. (P)bmp15, ZZ cells at both 19dpf and 30dpf. (Q)buc, ZW cells at both 19dpf and 30dpf. (R). buc, ZZ cells at both 19dpf and 30dpf. (S)zp2.2, ZW cells at both 19dpf and 30dpf. (T)zp2.2, ZZ cells at both 19dpf and 30dpf. (U)dmrt1, ZW cells at both 19dpf and 30dpf. (V)dmrt1, ZZ cells at both 19dpf and 30dpf. (W)spo11, ZW cells at both 19dpf and 30dpf. (X)spo11, ZZ cells at both 19dpf and 30dpf. (Y)hormad1, ZW cells at both 19dpf and 30dpf. (Z)hormad1, ZZ cells at both 19dpf and 30dpf. (AA) rad21l1, ZW cells at both 19dpf and 30dpf. (BB) rad21l1, ZZ cells at both 19dpf and 30dpf. (CC)smc1b, ZW cells at both 19dpf and 30dpf. (DD) smc1b, ZZ cells at both 19dpf and 30dpf. (EE) sycp3, ZW cells at both 19dpf and 30dpf. (FF)sycp3 ZZ, cells at both 19dpf and 30dpf.

Support cell gene expression merging both time points and both sex genotypes. (A)gsdf expression across the whole combined dataset. The rectangle marks gsdf-expressing support cells and their precursors, expanded to show cluster assignments in color. (B) Enlargement of rectangle from part A, showing gsdf expression in clusters 1930c30, c21, and c8 combining all four conditions. (C)gsdf expression in 19dpf ZW gonads. (D)gsdf expression in 30dpf ZW cells. (E)gsdf expression in 19dpf ZZ cells. (F)gsdf expression in 30dpf ZZ cells. (G–L)amh expression in samples as described for (B–F). (M–R)foxl2a expression. Box in M around 1930c18 is expanded as inserts in (N–R). (S–X)cyp19a1a expression. Boxed insert in (S) around 1930c18 appears as inserts in (T–X).

Steroidogenesis. (A). An abbreviated pathway of steroidogenesis (after (Tenugu et al., 2021)). (B)nr5a1b expression. The left panel shows expression in the entire dataset. The insert shows cluster demarcation for the most relevant steroidogenic enzymes. Subsequent panels show, at the top 1930c21, the support cell precursor and granulosa cell cluster and at the bottom the clusters corresponding to the insert in the left panel. Displayed from left to right are the enlargements of all four conditions: 19dpf ZW gonads, 30dpf ZW gonads, 19dpf ZZ gonads, and 30dpf ZZ gonads. Cluster numbers are indicated. (C) cyp11a1.2 displayed as explained for nr5a1b. (D)cyp17a1. (E)cyp19a1a. (F). hsd17b1. (G)hsd17b3. (H)cyp11c1. (I)hsd11b2. Abbreviations: L, Leydig cells; th, theca cells.

Stromal/interstitial clusters.
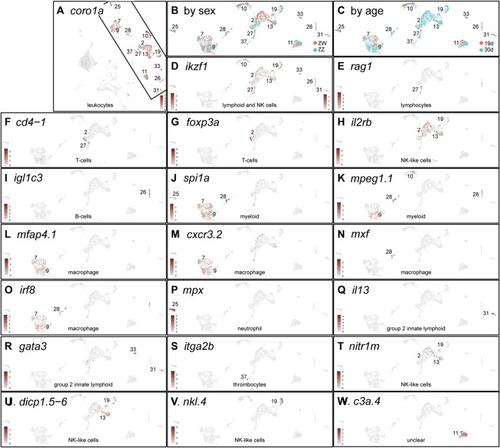
 (A) Expression of col1a1a defines stromal/interstitial cells (Liu et al., 2022). The left large panel combines cells of all four conditions for the complete dataset and the four smaller panels to the right show an enlargement of the col1a1a-expressing domain for each condition independently. At 19dpf, ZW and ZZ expression patterns are similar but at 30dpf, some clusters are sex-genotype specific. (B) The UMAP is in the left large panel; the middle panel shows the col1a1a-expressing region for samples separated by sex genotype (red, ZW; blue, ZZ); and the right panel shows samples separated by age (red, 19dpf; blue, 30dpf). (C)acta2 expression, with panels as described for (A). (D)panx3 expression in the 30dpf ZZ-specific cluster 1930c32. (E)efn2b expression, indicating likely arterial endothelial cells in 1930c22 boxed in the large panel and expanded in the four condition-specific panels to the right. (F)lyve1a expression, a marker of lymphatics, labeling 1930c22.

Immune cells. (A)coro1a expression identifying leukocytes displayed for all four conditions analyzed together. The remainder of the panels show the boxed region rotated counterclockwise. (B) Cells labeled according to sex genotype (red, ZW; blue, ZZ). (C) Cells labeled according to age (red, 19dpf; blue, 30dpf). (D)ikzf1. (E)rag1. (F)cd4-1. (G)foxp3a. (H)il2rb. (I)igl1c3. (J)spi1a. (K)mpeg1.1.(L)mfap4.1. (M)cxcf3.2.(N)mxf.(O)irf8.(P)mpx. (Q)il13.(R)gata3. (S)itga2b.(T)nitr1m. (U)dicp1.5-6. (V)nkl.4. (W)c3a.4.

Acknowledgments
This image is the copyrighted work of the attributed author or publisher, and ZFIN has permission only to display this image to its users. Additional permissions should be obtained from the applicable author or publisher of the image. Full text @ Front Cell Dev Biol