FIGURE SUMMARY
Title

Aiouea padiformis extract exhibits anti-inflammatory effects by inhibiting the ATPase activity of NLRP3

Authors
Lee, S., Ye, Q., Yang, H., Lee, S., Kim, Y., Lee, N., Gonzalez-Cox, D., Yi, D.K., Kim, S.Y., Choi, S., Choi, T., Kim, M.S., Hong, S.S., Choi, C.W., Lee, Y., Park, Y.H.
Source
Full text @ Sci. Rep.

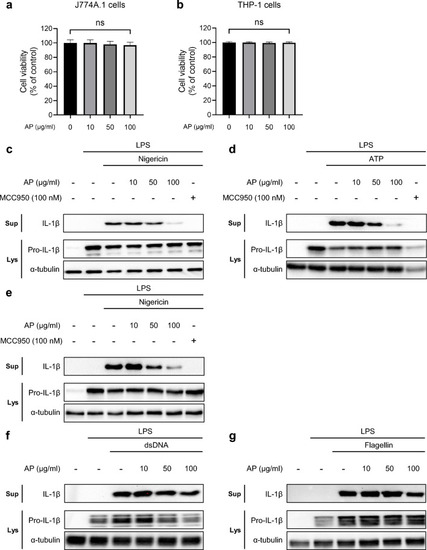
AP specifically reduces NLRP3 inflammasome activation. (a,b) Cell viability assays of J774A.1 cells (a) and differentiated THP-1 cells (b) treated with AP (10 μg/mL, 50 μg/mL, 100 μg/mL) for 2 h. Cell viability was analyzed by EZ-CYTOX, measured at a wavelength of 450 nm. Ns not significant. (c–e) Western blots of IL-1β in the supernatants (Sup), pro-IL-1β and α-tubulin in the soluble lysates (Lys) of treated cells. LPS-primed J774A.1 cells were treated with AP for 2 h and activated for 30 min with nigericin (10 μM) (c) or ATP (5 mM) (d) with or without MCC950, differentiated, and LPS-primed THP-1 cells were treated with AP for 2 h and activated for 30 min with nigericin (10 μM) with or without MCC950 (e). (f,g) LPS-primed J774A.1 cells were treated with AP for 2 h and activated for 3 h with transfection of dsDNA (2 μg/mL) (f) or flagellin (1.25 μg/mL) (g).

AP does not affect the NF-κB signaling pathway. (a) 293 T cells were transfected with the pGL4.32 luciferase reporter vector and treated with TNF-α (20 ng/mL) for 5 h with or without AP. Luciferase activity was analyzed using the Promega Bright-Glo™ Luciferase Assay System. (b) LPS-primed J774A.1 cells were treated with AP for 2 h and activated for 30 min with nigericin (10 μM). IL-1β in the supernatants (Sup), phospho-NF-κB and NF-κB in the soluble lysates (Lys) were analyzed using a Western blot.

AP inhibits NLRP3 inflammasome, regardless of K+ efflux, intracellular ROS, and mitochondrial membrane potential. (a) LPS-primed J774A.1 cells were treated with AP for 2 h and activated with Imiquimod (200 μM) for 1 h. (b,c) LPS-primed J774A.1 cells treated with AP (50 μg/mL) for 2 h and activated with ATP (5 mM) for 5 min. Representative immunofluorescence images of ROS (DCFDA; green color) (b) and mitochondrial membrane potential (JC-1 monomer; green color, J-aggregates; red color) (c) were taken by a confocal laser-scanning microscope (Carl Zeiss, LSM710, scale bar, 20 μm).

AP blocks NLRP3 inflammasome assembly by hindering ATPase activity of NLRP3. (a) HEK 293FT cells were transfected with NLRP3-Myc and treated with or without AP for 2 h. The interaction between NLRP3 and NEK7 was analyzed by immunoprecipitation and immunoblot. (b) The ATPase activity of NLRP3 with or without AP was measured by luminescence using the ADP-Glo™ Max assay. (c) LPS-primed THP-1 cells were treated with AP for 2 h and activated with nigericin (10 μM) for 30 min. The cell pellet was cross-linked by DSS (2.5 mM) for 30 min. ASC oligomerization was analyzed by immunoblot. (d,e) LPS-primed J774A.1 cells treated with AP for 2 h and activated with nigericin (10 μM) for 30 min. Representative immunofluorescence images of ASC speck formation (indicated by arrows) were taken by a confocal laser-scanning microscope (Carl Zeiss, LSM710, scale bar, 20 μm) (d). Graph representing the number of cells containing ASC specks in all treatments (e).

AP alleviates inflammatory response induced by LPS treatment in zebrafish. (a) Representative images of posterior areas of Sudan Black B-stained zebrafish embryos after LPS induction and AP treatment at 3 dpf. The upper panel shows the control group with DMSO (0.025%) treatment, the middle panel shows LPS inflammation group, and the bottom panel shows the LPS inflammation group after treatment with 10 µg/mL AP. (b) Quantification of neutrophils in the posterior region of zebrafish after LPS induction and AP treatment. (c) Representative images of the caudal hematopoietic tissues after LPS induction and AP treatment at 3 dpf. Whole-mount in situ hybridization was conducted using an mpx probe. (d) Representative images of anterior Sudan Black B-stained zebrafish embryos following direct LPS injection and AP treatment at 3 dpf. (e) Quantification of the number of neutrophils in the anterior zebrafish embryos after LPS induction and AP treatment. All graphs represent the mean ± S.E.M. of individual values. P-values were calculated using an unpaired two-tailed Student’s t-test. *P < 0.05; **P < 0.01; ***P < 0.001.

Acknowledgments
This image is the copyrighted work of the attributed author or publisher, and ZFIN has permission only to display this image to its users. Additional permissions should be obtained from the applicable author or publisher of the image. Full text @ Sci. Rep.