
- Title
-
Comparing robotic and manual injection methods in zebrafish embryos for high-throughput RNA silencing using CRISPR-RfxCas13d
- Authors
- Del Prado, J.A., Ding, Y., Sonneville, J., der Kolk, K.V., Moreno-Mateos, M.A., Málaga-Trillo, E., Spaink, H.P.
- Source
- Full text @ Biotechniques

Overview of the zebrafish egg injection robot and experimental outline. (A) A representative image of the integrated egg injector. The needle holder is used to load needles and the motorized stage enables the movement of plates containing embryos during injections. A 96-well plate is for droplet calibration and the agarose gel grid plate is for the placement of zebrafish eggs. A touch screen allows for the operation and visualization of all the injection processes. (B–H) The procedure of zebrafish embryo injection using the robot. (B) Step1: preparation of an agarose grid plate using a mold. Different molds (e.g., 9 × 100, 1024, 360 grid wells) can be used based on research purposes. (C) Step 2: placement of zebrafish eggs on the agarose grid. Zebrafish embryos can be placed randomly at any wells of the grid, as empty wells can be recognized and skipped by the robot. (D) Step 3: needle calibration for both xy direction and z direction, as shown on the screenshots from the touch screen. (E) Step 4: droplet calibration is performed by injection of suspension into mineral oil and droplet size can be determined automatically by the robot. (F) Step 5: injection positions should be chosen, either yolk center or close to the first cell; subsequently, the robot can do injections automatically for wells that users have selected. Different injection distances (e.g., 0 μm, 30 μm and 50 μm) can be chosen for close to the first cell injection. (G) Step 6: noninjected eggs can be killed by loading a blunt needle. (H) Step 7: after the injection is finished, the injected zebrafish eggs can be transferred to petri dishes for culture and dead eggs should be removed. |
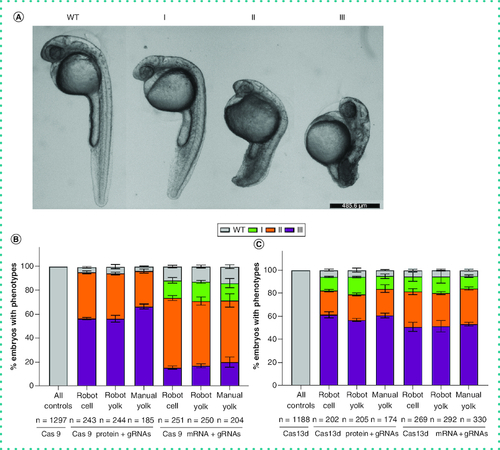
Percentage of zebrafish embryos with different grades of no tail phenotype caused by TBXTA gene knockdown. (A) Knockdown of the TBXTA gene using both Cas9 and RfxCas13d (CasRx) systems results in different levels of no tail phenotype. Representative phenotype images are acquired from CasRx injections. Scale bar = 485.6 μm. (B) Percentage of embryos of each grade of no tail phenotype caused by Cas9 protein or mRNA targeting TBXTA gene using automatic robot or manual injections. As all the control groups injected either with Cas9 protein or mRNA only show the wild-type phenotype, the authors combined all the control groups to one bar, namely “All controls” (Cas9 protein robot, n = 434; Cas9 protein manual, n = 213; Cas9 mRNA robot, n = 447; Cas9 mRNA manual, n = 203). (C) Percentage of embryos of each grade of no tail phenotype caused by CasRx protein or mRNA targeting TBXTA gene using automatic robot or manual injections. As all the control groups injected with either CasRx protein or mRNA only showed the wild-type phenotype, the authors combined all the control groups to one bar, namely “All controls” (CasRx protein robot, n = 334; Cas13d protein manual, n = 173; CasRx mRNA robot, n = 432; CasRx mRNA manual, n = 249). Type I: Short tail and normal notochord; type II: Notochord development failure and short tail; type III: Notochord development failure and shorter tail; WT: Normal tail and notochord. |