
- Title
-
Direct Activation of Nucleobases with Small Molecules for the Conditional Control of Antisense Function
- Authors
- Bardhan, A., Brown, W., Albright, S., Tsang, M., Davidson, L., Deiters, A.
- Source
- Full text @ Angew. Chem. Int. Ed. Engl.
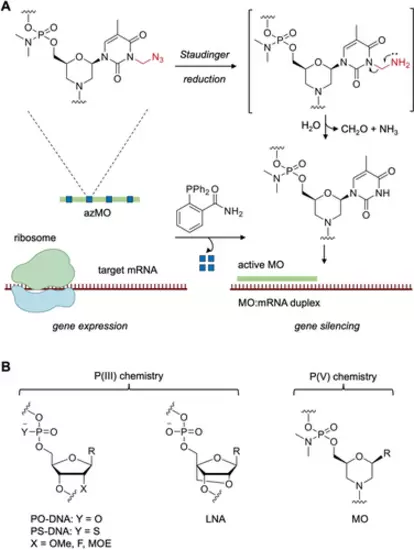
A) Regulation of gene expression through use of azidomethylene (Azm) caged MOs (azMOs). The azMO is unable to bind to its target mRNA until activated by exposure to the phosphine 2DPBM (2-(diphenylphosphino)benzamide). The Azm group undergoes a Staudinger reduction followed by rapid fragmentation to liberate the free MO which then silences gene expression. B) Common antisense oligonucleotide chemistries (PS, OMe, F, MOE) and morpholino oligonucleotide (MO) chemistry, R=nucleobase. |

A) Assembly of the Azm caged thymidine-MO chlorophosphoramidate 7 for solid-phase synthesis of caged morpholino oligonucleotides. B) Sequences of the noncaged (MO) and caged morpholinos (azMO). The caged nucleobases in the azMOs are bolded and marked with an asterisk (T*) and the anti-start codon is underlined. |

A) Melting temperatures of the noncaged and caged MOs with their respective cDNA. Error bars represent standard deviations from the average of two independent experiments. B) Gel-shift assay of EGFP-MO and EGFP-azMO duplex formation with cDNA (0.2 μM). The concentrations of EGFP-MO and EGFP-azMO are 0, 0.05, 0.1, 0.2, 0.3, 0.4 and 0.6 μM. C) Decaging time course of the EGFP-azMO (0.3 μM) in the presence of cDNA (0.2 μM) upon treatment with 2DPBM (15 μM). The incubation times are 0, 10, 20, 30, 40, 60 and 90 min. D) Quantification of the decaging time course assay. Error bars represent standard deviations from the average of three independent experiments. |

A) In vitro translation assay with the ntla-azMO using an ntla-luciferase reporter construct. Upon addition of 2DPBM (100 μM), silencing of luciferase expression is observed, matching the noncaged ntla-MO positive control. Average luminescence was determined from three independent experiments and error bars represent standard deviations. ctl=negative control MO. B) Quantification of silencing of EGFP expression in HEK293T cells, showing 2DPBM-triggered off to on switching that matches the negative and positive (MO) controls. Fluorescence was integrated in four fields (n=4) of view and error bars represent standard deviations. **p<0.002, ns=non-significant (p>0.05), calculated from two-tailed Welch's t-tests. C) Representative micrographs of EGFP silencing in HEK293T cells. Scale bar=100 μm. |

Small molecule-mediated activation of azMOs in zebrafish embryos. A) Representative phenotypes from ntla knockdown. B) Tuning the duration of 2DPBM exposure produces a dose response in phenotype in the ntla-azMO injected embryos. C) Activation of ntla-azMO function at defined developmental timepoints (1, 3, 4, 7, and 24 hpf). D) Activation of EGFP silencing in embryos at 24 hpf. E) Representative images of embryos at 24 hpf from EGFP silencing experiments. Scale bars=0.5 mm. |

Orthogonal activation of azMO and NPOM MO in zebrafish embryos. A) Activation of ntla-azMO function with light or small molecule trigger. B) Activation of EGFP-NPOM MO function with light or small molecule trigger. |
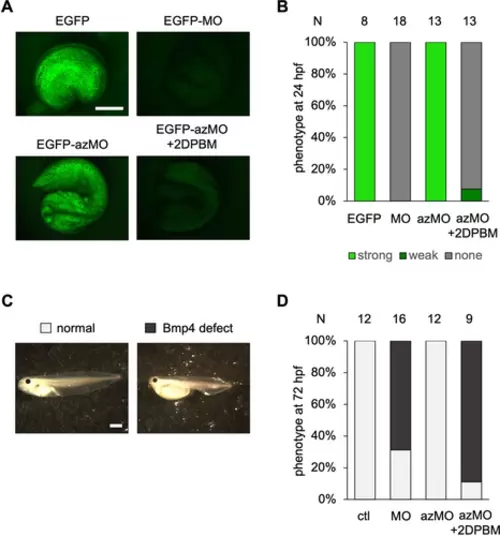
Small molecule-triggered activation of azMO function in Xenopus embryos. A) Representative images of embryos at 24 hpf from EGFP-targeting azMO experiments. B) Activation of EGFP silencing in Xenopus embryos at 24 hpf. C) Representative images of Xenopus embryos at 72 hpf from bmp4 silencing using Bmp4-azMO. D) Scoring of embryos at 72 hpf from bmp4 silencing experiments. Scale bars=0.5 mm. |