FIGURE SUMMARY
Title

Leveraging chromatin state transitions for the identification of regulatory networks orchestrating heart regeneration

Authors
Cordero, J., Elsherbiny, A., Wang, Y., Jürgensen, L., Constanty, F., Günther, S., Boerries, M., Heineke, J., Beisaw, A., Leuschner, F., Hassel, D., Dobreva, G.
Source
Full text @ Nucleic Acids Res.

H3K27ac dynamics during zebrafish heart regeneration. (A) Schematic representation of the experimental setup of the study. (B) Unsupervised k-means clustering of normalized enrichment of H3K27ac at different time points after cryoinjury of zebrafish hearts. Clustering was performed using positively correlating H3K27ac peaks with the expression of associated genes. Values are the z-score from the log2 of the mean of RPKM + 1. (C) Dot plots displaying the representative gene ontology (GO) terms of genes associated to peaks in the different H3K27ac clusters. (D) Percentage of super enhancers (SE, brown) and typical enhancers (TYE, blue) in the different clusters during the course of regeneration. Rank Ordering of Super Enhancer (ROSE) for H3K27ac peaks was performed to identify SE. (E) Heatmap showing the TF motifs associated to the different clusters of H3K27ac. (F) Interaction network of TFs identified by motif analysis of genomic regions within clusters 4 (C4) (top panel), cluster 2 (C2, middle panel) and cluster 1 (C1, bottom panel). For this and the following figures, black circles represent TFs with the highest interaction score according to STRING database (default settings). The thickness of the line connecting the different proteins represents the strength of the protein-protein interaction.

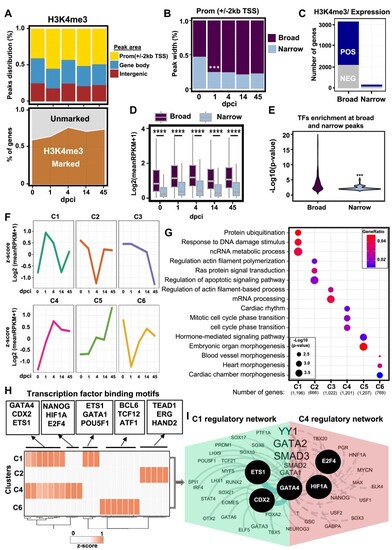
H3K4me3 breadth correlates with transcriptional activity in zebrafish heart regeneration. (A) Distribution of H3K4me3 peaks at the promoter (TSS ± 2 kb) (yellow), genebody (TSS > 2 kb) (blue), and intergenic regions (maroon) (top panel). Values are the percentage of each region at each time point. Density plot showing the percentage of genes associated with H3K4me3 peaks (bottom panel). Values are the percentage of marked genes (dark brown) with at least one peak of H3K4me3. (B) Stacked bar plot showing the breadth of H3K4me3 peaks at different time points after heart injury. Broad peaks (>0.5 kb; top 50%) (dark violet), and narrow peaks (<0.5 kb; bottom 50%) (light blue). P-values **P < 0.001 calculated after Fisher's exact test. (C) Percentage of genes characterized by broad and narrow H3K4me3 peaks, positively or negatively correlating to the expression of the neighboring gene, after Spearman's rank correlation. (D) Boxplot showing the expression of genes associated with H3K4me3 peaks, separated by the broadness of the H3K4me3 peak. Values are the log2 from the mean of reads per kilobase million (RPKM)+1. (E) Violin plot showing the transformed log10 from the p-value after hypergeometric test of findMotifsGenome.pl from Homer over the background. (F) Unsupervised k-means clustering of the normalized enrichment of H3K4me3 at broad peaks correlating with gene expression. Correlation after Spearman′s rank test correlation (rho ≤ -0.3 or rho ≥ 0.3 and P-value < 0.35). Values are the z-score from the log2 of the mean of RPKM + 1. (G) Dot plots displaying the representative gene ontology (GO) terms of genes associated with H3K4me3 peaks in the different clusters. P-value was determined by enrichGO from clusterprofiler after ORA test. (H) Heatmap showing enriched TF motifs in the selected clusters. The associated factors were selected according to the workflow presented in Supplementary Figure S1C. The values represent the z-score of the –log10P-value. (I) Interaction network of TFs enriched in C1 (green) and C4 (pink).

Large-scale acquisition of repressive chromatin marks one day after heart injury. (A) Schematic representation of the different chromatin states. (B) Alluvial plot representing the dynamic of chromatin states in (A) with reference point 1 dpci. Activated enhancers and promoter areas (A) changing from active at 0 dpci to inactive (Ia) at 1 dpci (A_Ia, red). Inactive areas were the combination of Ep, Er, Epr, BiV and Ps. Transitions from inactive to active chromatin state at 1 dpci (Ia_A, light brown), unmarked areas to active enhancers (U_Ea, violet), unmarked areas to inactive chromatin states (U_Ia, grey), unmarked areas to active promoters (U_Pa, light blue). The Y-axis values are frequency of the assigned divergent region. Unmarked, represents genomic area without any significant enrichment of the studied histone marks, i.e. bellow the Quartile 1 (Q1) for H3K27ac, H3K27me3 and H3K4me1, and value of 1 for H3K4me3. (C) GO terms of the dynamic chromatin state groups presented in panels A and B. Example genes from each GO are presented to the right. (D) T-distributed stochastic neighbor embedding (t-SNE) visualization displaying the dynamic chromatin state transition groups (top) and the distribution of TF motifs (bottom). (E) Heatmap showing the enrichment of TF motifs in the clusters presented in (D, bottom panel). (F–H) Interaction network of TFs with enriched motifs in clusters associated with A_Ia transition (F), in clusters associated with U_Ia transition (G) and C2 associated with U_Pa transition (H).

Switch between inactive to active chromatin states four days after injury. (A) Alluvial plot representing dynamic chromatin states with a reference point 4 dpci. (B) GO terms of the genes within the dynamic chromatin state groups presented in panel A. Example genes from each GO are presented to the right. The P-value was determined by ORA. (C) T-distributed stochastic neighbor embedding (t-SNE) visualization displaying the dynamic chromatin state transition groups (top) and the distribution of TF motifs (bottom). (D) Heatmap showing the enrichment of TF motifs in the clusters presented in (C, bottom panel). (E–G) Interaction network of TFs with enriched motifs in all clusters associated with Ia_A transition (E), the highly dynamic C1, C10 and C11 clusters (F) and C3 and C4 associated with U_Pa transition (G) at 4 dpci.

Transition from active to inactive chromatin state between 4 dpci and 14 dpci marks the start of the healing process. (A) Alluvial plot representing the dynamic chromatin states with reference point 14 dpci. (B) GO terms of the genes within the dynamic chromatin state groups presented in panel A. Example genes from each selected GO are presented to the right. The p-value was determined by enrichGO from clusterprofiler using ORA test; p-value *P < 0.05. (C) T-distributed stochastic neighbor embedding (t-SNE) visualization displaying the dynamic chromatin state transition groups (top) and the distribution of TF motifs (bottom). (D) Heatmap showing the enrichment of TF motifs in the clusters presented in (C, bottom panel). (E–H) Interaction network of TFs with enriched motifs in the largest cluster C1 associated with A_Ia transition (E), all clusters associated with A_Ia transition (F), with U_Ia transition (G) and cluster 3 associated with U_Pa transition (H) at 14 dpci.

Conservation of chromatin state transitions between zebrafish and neonatal mice after heart injury. (A) Schematic representation of the experimental flow to identify converted regulatory regions in zebrafish (danRer11) and mouse (mm10) genomic areas. (B, C) Average H3K27ac ChIP-seq profiles of neonatal hearts at different time points (day D1.5, D3 and D7) after inducing myocardial infarction (MI) at 1 day post birth (P1) at conserved regions showing Ia_A (B) and U_Pa transitions at 4 dpci (C) (7,8) (GSE123868). (D) Genome tracks of H3K27ac ChIP-seq reads of neonatal hearts at different time points after MI at representative genes. (E) Enriched GO terms in genes associated with the U_Pa (cyan) and the Ia_A chromatin state transitions (beige). The P-value was determined by enrichGO from clusterprofiler after the ORA test; P-value *P < 0.05. (F) Heatmap displaying the enriched DNA binding proteins associated with the conserved chromatin state transition groups. (G) Heatmap displaying the expression of transcription factors associated with conserved Ia_A, U_Ea and U_Pa chromatin state transitions, and downstream regulatory genes at D3 after MI at P1 in single-cell RNA sequencing datasets from neonatal hearts (GSE153481). (H) Heatmap displaying the expression of transcriptional factors associated with conserved Ia_A, U_Ea and U_Pa chromatin state transitions, and downstream regulatory genes at D3 after MI in CM single-cell data (GSE130699).

Functions of identified TFs in CM dedifferentiation and proliferation. (A) Schematic representation of the experimental setup for A–H. (B) Real-time PCR analysis of CM marker genes in P4 CMs after TF silencing. n = 4 biological replicates. (C, D) Representative immunostainings for the mitotic marker phospho-histone H3 (pH3S10) (red), α-actinin (green) and DAPI (blue) of P4 CMs, after siRNA mediated silencing of the indicated in the figure TFs (C) and quantification of pH3+ CMs (D). 200–300 cells were quantified in D. Arrows indicate pH3-positive (pH3+) cells. Scale bar: 10 μm. (E, F) Representative histograms showing FACS analysis of EdU+ cells after overexpression of human BMAL1 and YY1 in P4 CMs (E) and quantification of the percentage of EdU + CMs (F). n = 3 biological replicates. (G, H) Representative immunostainings of control, BMAL11 or YY1 overexpressing P4 CMs for the mitotic marker pH3S10 (red), α-actinin (green) and DAPI (blue) (G) and quantification of pH3+ CMs (H). 200–300 cells were quantified. Arrows indicate pH3+CMs cells. Scale bar: 10 μm. (I) Schematic representation of the co-culture of P4 CMs with HUVECs overexpressing control construct or human BMAL1, FOS, GATA2 alone, or OCT4, SOX2 and NANOG in combination, followed by subsequent analysis. (J, K) Representative histograms showing FACS analysis of EdU+ P4 CMs after 48 hours of co-culture with HUVECs overexpressing the indicated in the figure TFs (J) and quantification of the percentage of EdU+ CMs (K). n = 3 biological replicates. (L) Quantification of pH3 + P4 CMs after 48 h of co-culture with HUVECs overexpressing the indicated in the figure TFs. 200–300 cells were quantified. Data are presented as mean ± SD. Differences between groups were assessed using an unpaired two-tailed Student's t-test. *P< 0.05, **P< 0.01, ***P< 0.001.

Acknowledgments
This image is the copyrighted work of the attributed author or publisher, and ZFIN has permission only to display this image to its users. Additional permissions should be obtained from the applicable author or publisher of the image. Full text @ Nucleic Acids Res.