
- Title
-
Rewiring of the epigenome and chromatin architecture by exogenously induced retinoic acid signaling during zebrafish embryonic development
- Authors
- Moreno-Oñate, M., Gallardo-Fuentes, L., Martínez-García, P.M., Naranjo, S., Jiménez-Gancedo, S., Tena, J.J., Santos-Pereira, J.M.
- Source
- Full text @ Nucleic Acids Res.

Dynamics of RARαa binding to chromatin during zebrafish embryonic development. (A) Heatmaps of the 8084 RARαa BSs obtained from ChIP-seq in 80% of epiboly, 5 somites and 24 hpf stages (n = 2 biological replicates per stage). Peaks were clustered using k-means clustering, obtaining six clusters, with three of them showing a clear dynamic behavior: cluster 4 (n = 672), or early BSs, cluster 5 (n = 2059) or intermediate BSs, and cluster 3 (n = 1764) or late BSs. Average profiles of clusters 4, 5 and 3 are shown on top. (B) Motif enrichment analysis of the early (top), intermediate (medium) and late (bottom) RARαa BSs. Five representative motifs of the top-10 were chosen. Motif logos are represented with their position in the top-10, the TF names, the enrichment p-values and the percentage of sites showing the motif. (C) Zebrafish wild-type expression terms enriched for the genes associated with dynamic RARαa BSs. The top-10 terms for each stage have been combined. (D) Genome tracks of RARαa ChIP-seq at the indicated developmental stages showing signal intensities in the dhrs3b locus. The Genes track represents ENSEMBL annotated genes. |

Transcriptomic effects of RA treatment to zebrafish embryos. (A) Picture depicting the treatments with 0.1 μM all-trans retinoic acid (atRA) of zebrafish embryos at different developmental stages. (B) Top, pictures of zebrafish embryos at 80% of epiboly, 12 somites and 24 hpf stages treated with DMSO (-atRA) or 0.1 μM atRA (+atRA). Bottom, embryo length measured as indicated with yellow lines in the pictures. (C) GO Biological Process terms enriched for the upregulated and downregulated genes. The top-10 terms for each stage have been combined. (D) Lateral views of whole mount in situ hybridization experiments of the hoxb1a, hoxb6a, meis2b and sox3 genes in control and atRA-treated embryos at 12 somites stage. |

Changes in chromatin accessibility and TF binding induced by RA treatment. (A) Differential analyses of chromatin accessibility between atRA and DMSO treated embryos at 80% of epiboly, 12 somites and 24 hpf stages from ATAC-seq data (n = 2 biological replicates per stage and condition). The log2P-value versus the log2 fold-change of accessibility is plotted. Regions showing statistically significant differential accessibility (adjusted P-value < 0.1) are highlighted in blue (increased) or red (decreased). The total number of differential peaks is shown inside the boxes. (B) GO Biological Process terms enriched for the genes associated with peaks with increased or decreased accessibility. The top-10 terms for each stage have been combined. (C) Motif enrichment analysis of the peaks with increased or decreased accessibility. The top-3 motifs have been selected for each stage. (D) Differential TF binding analysis in atRA and DMSO treated embryos at 80% of epiboly, 12 somites and 24 hpf stages from ATAC-seq data using TOBIAS. Volcano plots represent the differential binding score versus the –log10P-value. |

RA treatment leads to increased chromatin binding of its receptor RARαa. (A) Differential analysis of RARαa chromatin binding by ChIP-seq between atRA treated and control embryos at 80% of epiboly stage (n = 2 biological replicates per stage and condition). The log2P-value versus the log2 fold-change of ChIP-seq signal are plotted. Regions showing statistically significant differential binding (adjusted P-value < 0.05) are highlighted in blue (increased) or red (decreased). The total number of differential peaks is shown inside the box. (B) Violin plots showing the distribution of log2 fold-change of expression (RNA-seq) all DEGs and those associated with increased or decreased chromatin binding of RARαa. (C) Genome tracks of RARαa ChIP-seq, ATAC-seq and RNA-seq at 80% of epiboly stage showing signal intensities in the nr2f5 locus. The Genes track represents ENSEMBL annotated genes. (D) Heatmaps of the 1275 ATAC-seq peaks with increased accessibility in atRA treated embryos at 80% of epiboly stage, separating those overlapping (n = 376) or not (n = 880) RARαa peaks. Average profiles of both groups are shown on top. (E) Motif enrichment analysis of the peaks with increased accessibility and RARαa binding or without RARαa. The top-3 motifs have been selected for each stage. (F) Zebrafish wildtype expression terms enriched for the genes associated with increased ATAC-seq peaks and RARαa binding. No enriched GO terms were found for the genes associated with increased ATAC-seq peaks but without RARαa binding |
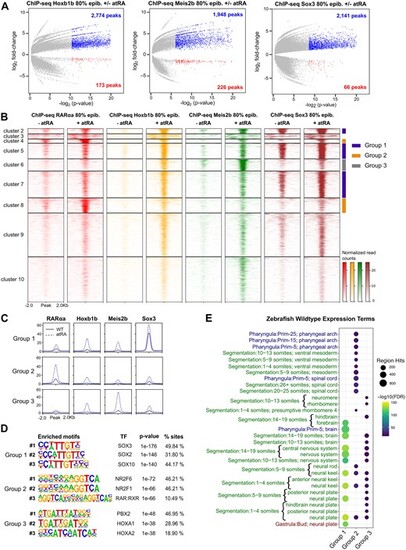
Chromatin binding of Hoxb1b, Meis2b and Sox3 is increased upon RA treatment. (A) Differential analysis of Hoxb1b, Meis2b and Sox3 chromatin binding by ChIP-seq between atRA treated and control embryos at 80% of epiboly stage (n = 2 biological replicates per condition). The log2P-value versus the log2 fold-change of ChIP-seq signal are plotted. Regions showing statistically significant differential binding (adjusted P-value < 0.05) are highlighted in blue (increased) or red (decreased). The total number of differential peaks is shown inside the boxes. (B) Heatmaps of the combined 4751 ChIP-seq peaks with increased binding of either RARαa, Hoxb1b, Meis2b or Sox3 obtained from ChIP-seq in 80% of epiboly. Peaks were clustered using k-means clustering, obtaining ten clusters, six of which were selected and combined in three groups with similar binding profiles of the four TFs: group 1 (n = 1286, blue), group 2 (n = 515, orange) and group 3 (n = 328), grey. Cluster 1 was too small to plot and was omitted. (C) Average profiles of groups 1, 2 and 3 of ChIP-seq peaks with increased TF binding upon atRA treatment. (D) Motif enrichment analyses of the groups 1, 2 and 3 of ChIP-seq peaks with increased TF binding upon atRA treatment. The top-3 motifs have been selected for each group. (E) Zebrafish wild-type expression terms enriched for the genes associated with groups 1, 2 and 3 of ChIP-seq peaks with increased TF binding upon atRA treatment. The top-20 terms for each stage have been combined |

Rewiring of promoter 3D interactions by RA signaling. (A) Differential analyses of H3K4me3 HiChIP loops between control and atRA treated embryos at 80epi stage (n = 2 biological replicates per condition) at 10-kb resolution. The log2 normalized counts per million (CPM) of control reads versus the log2 fold-change of contacts are plotted. Loops showing a statistically significant differential intensity (FDR < 0.05) are highlighted in red (increased) or blue (decreased). (B) Percentage of loops showing RARαa binding at least in one anchor for increased, stable and decreased loops. (C) Violing plots showing the expression fold-change in atRA treated embryos at 80epi of all DEGs and those associated with increased and decreased loops. (D) From top to bottom, heatmaps showing H3K4me3 HiChIP signal in control and atRA treated embryos, annotated genes, HiChIP loops increased by atRA treatment (FDR < 0.05), total HiChIP loops, tracks with ATAC-seq, RARαa ChIP- seq, and 4C-seq experiments at the indicated viewpoints (VP), in control and atRA treated embryos at 80epi stage, in a 400-kb region of chromosome 17 containing the upregulated gene meis2a. (E) Top, virtual 4C showing contact quantification calculated from H3K4me3 HiChIP data using as viewpoints 10-kb bins containing the gene promoters in the HoxBa cluster, both in control and atRA treated embryos at 80epi stage. A green vertical line indicates the bin used as viewpoint in each case. Bottom, annotated genes and tracks with ATAC-seq, RARαa ChIP- seq, and 4C-seq experiments at the indicated viewpoints (VP), in control and atRA treated embryos at 80epi stage, in a 320-kb region of chromosome 3 containing the HoxBa gene cluster. Boxplots in C show: center line, median; box limits, upper and lower quartiles; whiskers, 1.5× interquartile range; notches, 95% confidence interval of the median. Statistical significance was assessed using a two-sided Wilcoxon's rank sum test in C, and with a two-sided Fisher's exact test in B. |