
- Title
-
Endocardium gives rise to blood cells in zebrafish embryos
- Authors
- Gurung, S., Restrepo, N.K., Sumanas, S.
- Source
- Full text @ Cell Rep.

Myeloid marker expression analysis in the zebrafish endocardium (A–D) Myeloid marker spi1b expression analysis using hybridization chain reaction (HCR) in kdrl:GFP-positive endocardial cells at 26 hpf. Green (A), red (B), and merged channels (C) are shown. Higher-magnification view of the region marked by the square is shown in (D). Note multiple cells with overlapping expression (white arrows) embedded in the endocardial sheet. Additional cells are located outside of the endocardial sheet (yellow arrows). (E) Quantification of spi1b+ cells, positive (green) or negative (pink) for kdrl:GFP, located in the endocardium region (inside), or immediately adjacent to and touching the endocardial sheet (touching), or outside of the endocardium (outside). GFP-negative spi1b+ cells inside the endocardium are likely to include myeloid cells that adhere to the endocardial sheet but are not a part of the endocardium. Means ± SD are shown, n = 10 embryos. (F–I) Endocardial nfatc1 (green) and myeloid marker spi1b (red) expression analysis by HCR at 26 hpf. Higher-magnification view is shown in (I). Note the cells with overlapping expression (arrows). Punctate staining is due to the nature of HCR, which visualizes single mRNA transcripts in each cell. (J) Quantification of nfatc1+spi1b+ (green) and nfatc1−spi1b+ cells (pink). Means ± SD are shown, n = 7 embryos. (K–T) Neutrophil marker lyz and macrophage marker mpeg1.1 expression analysis using HCR in kdrl:GFP-positive endocardial cells at 26 hpf and its quantification. Note the lyz-expressing cells embedded in or adjacent to the endocardium (white and yellow arrows, respectively, N). In contrast, mpeg1.1 cells do not overlap with endocardial kdrl:GFP. Many mpeg1.1 cells are in a different z stack layer and may appear to overlap in a maximum-intensity projection. (O and T) show the quantification of GFP+lyz+ cells in green (O) and GFP−lyz+ (O) or GFP−mpeg1.1+ (T) cells in pink. No GFP+mpeg1.1+ cells were observed in these embryos. Means ± SD are shown, n = 3 (O) or 4 (T) embryos. In all images, confocal maximum-intensity projection of selected z stack planes is shown. The ventral view of flattened embryos, which were manually deyolked, is shown. The box within the embryo cartoon at the top left outlines the approximate area imaged. Scale bars, 20 μm (B, G, L, Q) or 10 μm (D, I, N, S). |
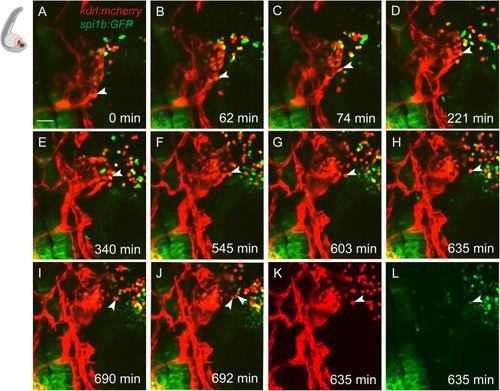
Endocardium can give rise to some myeloid cells in zebrafish embryos (A–L) Time-lapse images of the Tg(kdrl:mCherry); Tg(spi1b:GFP) reporter line starting at approximately 24 hpf showing migration of myeloid progenitors from the endocardium. Note a cell that detaches from the endocardial sheet, migrates away from the endocardium by 603 min, and divides by 692 min (arrowheads). The cell is positive for both kdrl:mCherry (K) and spi1b:GFP expression (L). Note that most green-only myeloid cells are presumably derived from the rostral blood island (RBI) and are negative for kdrl:mCherry expression. Time frames are selected from Video S1. n = 7 embryos from two experiments. Scale bar, 50 μm. |
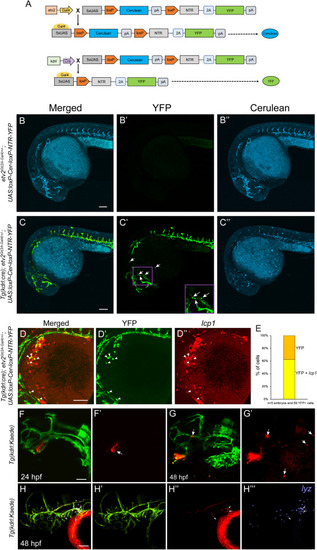
Lineage tracing of kdrl-expressing endocardial cells shows their contribution to the myeloid lineage (A) A schematic diagram showing Cerulean expression in etv2Gt(2A-Gal4)+/−; UAS:loxP-Cer-loxP-NTR-YFP in transgenic embryos and YFP expression in the presence of kdrl:Cre. (B–B″) Confocal imaging of an etv2Gt(2A-Gal4)+/−; UAS:loxP-Cer-loxP-NTR-YFP embryo shows Cerulean expression in the vasculature and the endocardium (Video S2) at 28 hpf. Note that no color switching from Cerulean to YFP occurs in the absence of Cre (B′). (C–C″) Confocal imaging of a Tg(kdrl:cre); etv2Gt(2A-Gal4)+/−; UAS:loxP-Cer-loxP-NTR-YFP embryo shows a switch from Cerulean to YFP in etv2-expressing cells at 28 hpf. (D and E) Confocal imaging and quantification of Tg(kdrl:cre); etv2Gt(2A-Gal4)+/−; UAS:loxP-Cer-loxP-NTR-YFP embryos analyzed by fluorescence in situ hybridization for the expression of the pan-leukocyte marker lcp1 at 28 hpf. The majority of round YFP-expressing cells outside of the vasculature are also positive for lcp1 expression. Note that only round cells located on top of the yolk outside of the vasculature were quantified. (F and G) Photoconversion of cells in the endocardium of Tg(kdrl:Kaede) embryos. Note that only endocardial cells were photoconverted from red to green at 24 hpf (arrow, F′), and no myeloid cells were photoconverted. The same embryo imaged at 48 hpf shows multiple round cells at the surface of the yolk or in the vasculature (arrows, G and G′). Red (F′ and G′) and merged green/red (F and G) channels are shown. (H–H‴) Tg(kdrl:Kaede) was photoconverted in the endocardium at 24 hpf and processed by HCR at 48 hpf for the neutrophil marker lyz (purple, H‴). A total of 69 red Kaede+ cells were observed in the head and yolk region (n = 5 embryos, 13.8 cells per embryo), 45 of which (65%) were also positive for lyz expression (arrows show selected cells). Lateral view, anterior to the left in all images. Scale bars, 100 μm. |

Myeloid cells in the endocardium form in the absence of Etv2 or Scl function (A–H) In situ hybridization analysis of myeloid progenitor marker spi1b (A–D) and pan-leukocytic marker lcp1 (E–H) expression in etv2ci32Gt+/− heterozygous (A and E) and etv2ci32Gt−/− mutant siblings (B and F) as well as in control WT uninjected (C and G) and scl MO-injected embryos (D and H) at 24 hpf. Note that myeloid cells are dispersed over the yolk in control embryos (A, C, E, and G) but are observed in the heart region in etv2 (B and F) and scl (D and H) deficient embryos at 24 hpf. Anterior is to the left. Scale bar, 100 μm. (I–L) FISH analysis for spi1b (I and J) or lcp1 (K and L) expression combined with myocardium-specific MF20 immunostaining in etv2ci32Gt+/− heterozygous and etv2ci32Gt−/− mutant embryos (I and J) or control WT uninjected and scl MO-injected embryos (K and L) at 24 hpf. Note that some spi1b- (I and J) and lcp1- (K and L) positive cells are inside the heart tube in all embryos, while the number of cells outside the heart is reduced in etv2- and scl-deficient embryos. The ventral view of deyolked and flat-mounted embryos is shown, anterior is to the top. Maximum-intensity projection is shown. Scale bar, 50 μm. (M) Quantification of spi1b-positive cells inside and outside of the heart tube in etv2ci32Gt+/− heterozygous (n = 15) and etv2ci32Gt−/− mutant (n = 13) embryos. Student’s t test, error bars show ± SD. NS, non-significant. (N–O′) FISH analysis for spi1b (magenta) and nfatc1 (green) expression to label myeloid cells and the endocardium, respectively, in etv2ci32Gt(2A-Gal4)+/− heterozygous (n = 5) and etv2ci32Gt(2A-Gal4)−/− mutant (n = 6) embryos in UAS:mCherry-NTR background (red) at 24 hpf. (N) and (O) (lower magnification, open box) and (N′) and (O′) (higher magnification) show co-localization of spi1b and nfatc1 in the heart region of both etv2+/− and etv2−/− embryos. Scale bar, 50 μm. (P–S) lcp1 expression is recovered in etv2−/− mutant and scl MO-knockdown embryos at 36 and 30 hpf, respectively. (T–U′) Photoconversion of endocardial cells in kdrl:Kaede embryos injected with etv2 MO. The same embryo imaged at 24 hpf immediately after photoconversion and at 48 hpf is shown. Note that multiple dispersed red cells (white arrows) are apparent at 48 hpf. Insets in (U) and (U′) show a different area of the yolk surface of the same embryo. Note that the endothelial development is greatly inhibited in etv2-MO-injected embryos at 24 hpf; therefore, the endocardium appears small and dysmorphic. White arrow in (T–T') shows endocardial cells immediately after photoconversion at 24 hpf, whereas the arrows in (U–U') show dispersed endocardial cells at 48 hpf. |

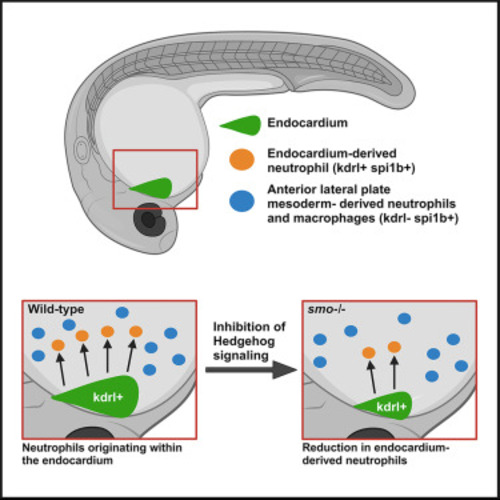
Gata5/6 and Hedgehog signaling are required for endocardial myelopoiesis (A–D) Co-injection of gata5 and gata6 MOs results in a complete or nearly complete absence of spi1b- (B) or lcp1-positive cells (D) compared with control uninjected embryos (A and C). In situ hybridization analysis of spi1b and lcp1 expression at the 24-hpf stage is shown. Scale bar, 100 μm. (E–J) Ventral view of the cardiac region of control and smo−/− mutant embryos processed for myeloid spi1b FISH (green) and myocardial (myoc.) MF20 immunostaining (red) at 24 hpf. Maximum-intensity projection is shown. Scale bar, 50 μm. (K) Quantification of cell number inside and outside the heart tube in control (n = 22) and smo−/− mutant (n = 24) embryos. Student’s t test, error bars show ±SD. NS, non-significant. |

Transcriptional signature of kdrl- and spi1b-positive cells Analysis of the previously reported scRNA-seq dataset from etv2Gt(2A-Gal4)+/−; UAS:GFP; kdrl:mCherry embryos at the 24-hpf stage. (A and B) UMAP (uniform manifold approximation and projection) feature plots showing expression of kdrl and spi1b. Note that kdrl is enriched in vascular endothelial and neutrophil clusters, while spi1b is enriched in neutrophil and macrophage clusters. (C and D) kdrl and spi1b co-expression (log2 > 0) in the neutrophil cluster. (E) Distribution of GFP+mCherry+ and GFP+mCherry− cells within the myeloid cell clusters. Note that most neutrophils are positive for kdrl:mCherry, while most macrophages are negative. (F–I) UMAP feature plots showing expression of macrophage-specific markers mpeg1.1 and csf1ra and neutrophil-specific markers lyz and mpx in the myeloid cell clusters. |
|