
- Title
-
Distinct epicardial gene regulatory programs drive development and regeneration of the zebrafish heart
- Authors
- Weinberger, M., Simões, F.C., Gungoosingh, T., Sauka-Spengler, T., Riley, P.R.
- Source
- Full text @ Dev. Cell

Gene expression programs in the developing and regenerating zebrafish epicardia are distinct (A) Overview of the RNA sequencing workflow. (B) Principal-component clustering of transcriptome samples. (C) Differential gene expression analysis of tcf21 larval epi versus tcf21 cryo. Shown are log2-transformed expression fold changes and Benjamini-Hochberg-adjusted Wald test p values. Significantly enriched genes (adjusted p value < 0.05) are colored in red. (D) GO term over-representation of genes enriched in tcf21 larval epi (versus tcf21 cryo, left column) and genes enriched in tcf21 cryo (right column). Bubble size depicts the magnitude of statistical enrichment, color significance. (E) Venn diagram depicting the overlap of gene expression enrichment across conditions. Indicated are the numbers of genes contained in each intersection. (F) Expression of genes enriched in tcf21 larval epi versus non-tcf21 larval heart and enriched in tcf21 cryo versus tcf21 sham. (G) mRNA staining of col12a1a (orange), mdka (magenta), and tcf21 (green) in a 5 dpf heart. (G′ and G′′) A nucleus (asterisk) in the epicardial region surrounded by col12a1a, mdka, and tcf21 transcripts. (H) mRNA staining of col12a1a (orange), mdka (magenta), and tcf21 (green) in a 3-dpi heart. Ia, injury area. (H′ and H′′) Single nuclei (asterisks) in the epicardial region surrounded by col12a1a, mdka, and tcf21 transcripts. Scale bars: 100 μm in (H); 20 μm in (G), (H′), and (H′′); and 5 μm in (G′) and (G′′). Color channels adjusted separately for brightness/contrast. (G) and (H) are single optical sections. dpf, days post fertilization; dpi, days post-injury; V, ventricle; A, atrium; BA, bulbus arteriosus. Number of biological replicates analyzed: tcf21 larval epi, n = 3; non-tcf21 larval heart, n = 3; tcf21 cryo, n = 3; tcf21 sham n = 2. See also Figure S1. |

Chromatin accessibility in the developing and regenerating zebrafish epicardia (A) Overview of the ATAC sequencing workflow. (B) Distance-based clustering of the Pearson correlations of larval and adult accessible chromatin profiles, as indicated by the dendrogram. Correlation values are indicated by color. (C–E) Relative quantification of peak distribution across genomic features (C), peak GC content (D), and peak CpG content (E). (F) Average relative sequencing read densities at TSSs. (G) Average peak size across genomic features. dpf, days post fertilization; dpi, days post-injury; V, ventricle; A, atrium; BA, bulbus arteriosus; bp, base pairs. Number of biological replicates analyzed: tcf21 larval epi, n = 2; non-tcf21 larval heart, n = 2; tcf21 cryo, n = 4; tcf21 sham, n = 2. In D,E, box and whiskers plots (in the style of Tukey) indicate median and first/third quartiles. |

Distinct chromatin accessibility profiles in the developing and regenerating epicardia (A) Differential peak accessibility analysis, comparing tcf21 larval epi with tcf21 cryo. Shown are log2-transformed accessibility fold changes and Benjamini-Hochberg-adjusted Wald test p values. Significantly enriched peaks (adjusted p value < 0.05) are colored in red. Highlighted are peaks located in the tcf21 locus. (B) Chromatin accessibility in the tcf21 locus. Peaks significantly enriched in cryoinjured versus larval epicardium are highlighted in red. (C) Relative quantification of differentially accessible peak distribution across genomic features. (D) GO term over-representation of genes located close to peaks enriched in tcf21 larval epi (left column) or tcf21 cryo (right column). Bubble size depicts the magnitude of statistical enrichment, color significance. (E) Differential accessibility of peaks located in the vicinity of marker genes of larval and adult cryoinjured epicardium (n = 52), quantified on gene level. Bubble color indicates the ratio of the number of differentially accessible peaks enriched in tcf21 larval epi versus the number of peaks enriched in tcf21 cryo (green = all tcf21 larval epi, brown = all tcf21 cryo, white = equal ratio). |

In vivo enhancer activity of differentially accessible chromatin regions in the mdka locus (A) Accessibility of peaks close to mdka. Red frames indicate peaks analyzed further in (B), (C), and (G) (e1) and (D), (E), and (H) (e2). (B) Stable mdka_e1-driven mCherry expression (magenta) at 5 dpf. Expression of tcf21 is indicated by myr-eGFP fluorescence (green membranes). (B′) Single optical section from (B). (B′′) mCherry fluorescence in the epicardium (asterisk). (C) Stable mdka_e1-driven mCherry expression in the adult cryoinjured heart at 3 dpi. (C′) High magnification image of a part of the injury area (ia) in (C). (D) Stable mdka_e2-driven mCherry expression (magenta) at 5 dpf. (D′) Single optical section from (D). (D′′) mCherry fluorescence in the epicardium (asterisk) is absent. (E) Stable mdka_e2-driven mCherry expression in the adult cryoinjured heart at 3 dpi. (E′) High magnification image of a part of the injury area in (E). An epicardial cell showing mdka_e2 activity is denoted by an asterisk. (F) Workflow of adult zebrafish heart injury followed by electroporation of enhancer activity reporter constructs. (G and H) Transient mCherry expression driven by mdka_e1 (G) or mdka_e2 (H) following electroporation into the cryoinjured adult heart. (G′, H′, and H′′) High magnification images of (G) and (H). In (H′) and (H′′), epicardial cells showing mdka_e2 activity are denoted by asterisks. Scale bars: 100 μm in (C), (E), (G), and (H); 50 μm in (B), (B′), (D), and (D′); and 20 μm in (B′′), (C′), (D′′), (E′), (G′), (H′), and (H′′). In (A), yellow: enrichment tcf21 larval epi, green: enrichment tcf21 cryo. (B) and (D) show endogenous fluorescence, (C), (E), (G), and (H) show immunefluorescence. V, ventricle; A, atrium; BA, bulbus arteriosus. See also Figure S2. |

Gene regulatory networks identify central transcriptional regulators in the developing and regenerating zebrafish epicardia (A) Quantification of TF motif presence in differentially accessible peaks in tcf21 larval epi versus tcf21 cryo. Selected motif logos are shown on the right. (B) Expression of TFs in larval, adult cryoinjured, and sham-treated epicardia. (C) Workflow to construct gene regulatory networks and to identify central regulators. (D and E) Eigenvector centrality in tcf21 larval epi and tcf21 cryo networks (D) and in tcf21 sham and tcf21 cryo networks (E). TFs with enriched centrality in cryoinjured epicardium are shown in blue, TFs with enriched centrality in sham-treated epicardium in purple. (F–H) In-degree centrality versus eigenvector centrality in tcf21 larval epi (F), tcf21 cryo (G), and tcf21 sham (H) sub-networks. In (D–H), selected regulators of both larval and adult epicardium are shown in red, regulators of larval epicardium in yellow, regulators of adult epicardium in green. In (D) and (E), AP-1 components are labeled in bold letters. Epi, epicardium. See also Figures S3 and S4. |

Differential transcriptomic regulation of genes expressed in both developing and regenerating zebrafish epicardia (A and B) Network connection scores within the network representing the developing epicardium (A) and that representing the regenerating epicardium (B) between selected TFs and genes expressed in both conditions. (C) TF motifs within the mdka_e1 sequence. (D) TF motifs within the mdka_e2 sequence. Representative accessibility of the endogenous genomic region in tcf21 larval epi (C) or in tcf21 cryo (D) is underlaid in gray. Bubble size indicates the eigenvector centrality of the factor in the tcf21 larval epi sub-network (C) or the tcf21 cryo sub-network (D). (E) mRNA staining of klf9 (magenta) and tcf21 (green) in a 5-dpf heart. (E′ and E′′) A nucleus (asterisk) in the epicardial region surrounded by klf9 and tcf21 transcripts. (F) mRNA staining of tbx2b (magenta) and tcf21 (green) in a 3-dpi cryoinjured adult heart. Ia, injury area. (F′ and F′′) A single nucleus (asterisk) in the epicardial region surrounded by tbx2b and tcf21 transcripts. (G) Predicted upstream transcriptional regulation in the developing epicardium. (H) Upstream regulation in the regenerating epicardium. In (G) and (H), all interactions are activating. Scale bars: 100 μm in (F); 20 μm in (E); and 5 μm in (E′), (E′′), (F′), and (F′′). Color channels have been adjusted separately for brightness/contrast. (E) and (F) are single optical sections. TFBS, transcription factor binding sites; V, ventricle. See also Figure S5. |
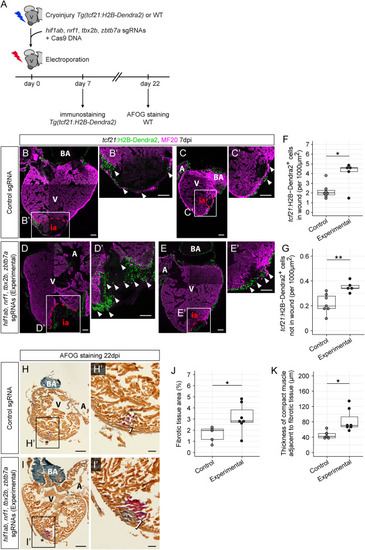
Loss of hif1ab, nrf1, tbx2b, and zbtb7a affects zebrafish heart regeneration (A) Workflow of adult zebrafish heart injury followed by electroporation of a Cas9 expression vector and a mix of hif1ab, nrf1, tbx2b, and zbtb7a sgRNAs (experimental condition) or a control sgRNA. (B–E) Control (B and C) and experimental (D and E) TgBAC(tcf21:H2B-Dendra2) hearts at 7 dpi, stained against Dendra2 (green) and MF20 (magenta). Shown are hearts with large injuries (B and D) and small injuries (C and E). (B′–E′) show magnifications of the injury areas in (B)–(E), respectively. Arrowheads indicate epicardial cells in the injury area. (F) Quantification of tcf21+ cardiac cell numbers in the injury area (∗p = 0.047). (G) Quantification of tcf21+ cardiac cell numbers in the non-injury area of the ventricle (∗∗p = 0.004). Cell numbers in (F) and (G) have been normalized against injury area (F) and non-injury ventricle area (G). In (F) and (G): n(control) = 7, n(experimental) = 5. (H and I) Acid Fuchsin Orange-G (AFOG) staining showing healthy tissue (orange-brown), fibrin (red), and collagen (blue) in control (H) and experimental (I) hearts at 22 dpi. Asterisks indicate the site of injury. (H′) and (I′) show magnifications of the injury areas in (H) and (I), respectively. Brackets indicate the thickness of the compact muscle layer at the injury site. (J) Quantification of AFOG-stained tissue areas, normalized against ventricle area (∗p = 0.028). (K) Quantification of the thickness of the compact muscle layer at the injury site (∗p = 0.015). In (J) and (K): n(control) = 5, n(experimental) = 7. Scale bars: 100 μm in (B)–(E) and (B′)–(E′), 200 μm in (H) and (I), and 50 μm in (H′) and (I′). A, atrium; BA, bulbus arteriosus; V, ventricle; WT, wild type; ia, injury area. In (F), (G), (J) and (K), box and whiskers plots (in the style of Tukey) indicate median and first/third quartiles. See also Figures S6 and S7 and Table S3. |
Reprinted from Developmental Cell, 59(3), Weinberger, M., Simões, F.C., Gungoosingh, T., Sauka-Spengler, T., Riley, P.R., Distinct epicardial gene regulatory programs drive development and regeneration of the zebrafish heart, 351-367.e6, Copyright (2024) with permission from Elsevier. Full text @ Dev. Cell