
- Title
-
ASS1 deficiency is associated with impaired neuronal differentiation in zebrafish larvae
- Authors
- Seidl, M.J., Scharre, S., Posset, R., Druck, A.C., Epp, F., Okun, J.G., Dimitrov, B., Hoffmann, G.F., Kölker, S., Zielonka, M.
- Source
- Full text @ Mol. Genet. Metab.
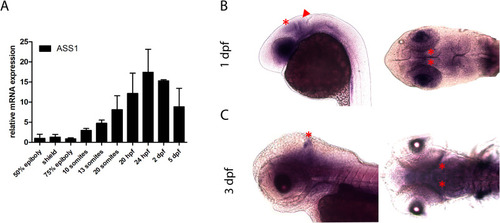
Zebrafish ASS1 homologue is expressed in the midbrain-hindbrain boundary (MHB) and the optic tectum (OT) during early development. (A) Endogenous mRNA expression of ASS1 during zebrafish development (50% epiboly to 5 dpf). Expression of ASS1 showed a monophasic expression pattern with increasing concentrations during neurulation peaking at 1 dpf. (B, C) Localization of mRNA coding for ASS1 in the CNS of zebrafish larvae as visualized by ISH. Images show the embryonic heads at stages indicated. Left columns of each row show lateral view with anterior to the left, and right columns illustrate top view with anterior to the left. ASS1 was expressed in the mes- and diencephalon mainly confined to the MHB (arrow head) and the OT (asterisk) at 1 dpf (B). At 3 dpf, ASS1 expression was retained and even more confined to a distinct zone in the OT (asterisk; C). Data are expressed as mean +/− SD in fold-change (A; whole body lysates, N = 3 with 50 larvae per group and experiment). |
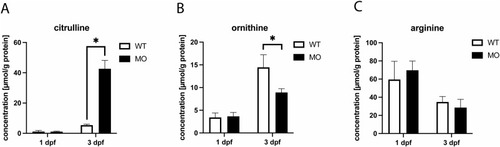
ASS1 deficiency is associated with citrulline accumulation and reduced concentration of ornithine. Wildtype zebrafish embryos were injected with either ASS1-targeting MO or mock at the 1-cell stage and subjected to quantitative analysis of amino acid concentrations applying HPLC at 1 dpf or 3 dpf, respectively. While concentrations of L-citrulline and L-ornithine were unaltered in response to MO-injection at developmental stage 1 dpf, ASS1-deficient zebrafish larvae exhibited a massive accumulation of L-citrulline at 3 dpf with concomitantly reduced concentration of L-ornithine (A, B), confirming impaired ASS1 function upon MO-injection. Notably, L-arginine concentrations remained unchanged at 1 and 3 dpf when compared to negative control (C). Data are expressed as μmol per g protein (A-C, whole body lysates, N = 3 with 50 larvae per group and experiment; Student's t-test, *P < 0.05). |
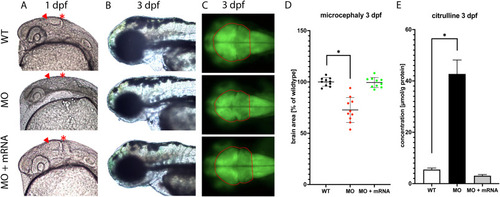
Knockdown of ASS1 causes morphological brain alterations with neuronal cell loss and reduced brain size. At the 1-cell stage, wildtype or tg(elavl3:eGFP) transgenic zebrafish larvae were injected with either MO targeting the zebrafish homologue of ASS1 or mock or combined injection of ASS1-targeting MO together with the human ASS1 mRNA was performed. Subsequently, zebrafish larvae were imaged using a binocular (fluorescence) microscope (MZ16F, Leica) at 1 or 3 dpf, respectively (A-C). Lateral view with anterior to the left (A, B) or top view with anterior to the left (C). Relative brain size of indicated cohorts in comparison to the mock-injected control (D). Alternatively, injected zebrafish larvae were subjected to quantification of L-citrulline concentration by HPLC (E). MO-injected wildtype zebrafish larvae exhibited reduced brain size and disorganized mes- and diencephalic structures (arrow head) with dissolved midbrain-hindbrain-boundary (asterisk), most prominent at 1 dpf (A, B). For comparative reasons, brain structures have also been marked in the wildtype and mRNA-treated cohort (A). Consistently, tg(elval3:eGFP) transgenic larvae injected with ASS1-targeting MO showed reduced brain size as indicated by eGFP-expressing neurons, predominantly involving the optic tectum (C), corresponding to approximately 80% of the mock-injected transgenic control (D). Intriguingly, coinjection of MO together with human ASS1 mRNA (450 pg/μL) rescued the morphological phenotype and restored brain size (A-D). Moreover, zebrafish larvae coinjected with MO and human ASS1 mRNA exhibited normalized L-citrulline concentration (E). Data are expressed as mean +/− SD of relative brain size (percentage of normal) in comparison to negative control (D) or μmol per g protein (E; whole body lysates; N = 5 with 50 larvae per group and experiment; ANOVA, *P < 0.05). |

Metabolic alterations associated with hyperammonemia are not accounting for the cerebral phenotype. Wildtype zebrafish larvae were injected with MO targeting the zebrafish homologue of ASS1 or mock at the 1-cell stage followed by quantification of NH4+, glutamate and glutamine concentrations applying HPLC (A, B) or determination of TCA cycle intermediates including lactate using GC/MS (C, D) at 1 or 3 dpf, respectively. Notably, MO-injection was not associated with NH4+ accumulation (A). Moreover, concentrations of glutamate and glutamine were unaltered in the MO-injected zebrafish cohort when compared to negative control at either developmental stage (B). Consistently, ASS1-deficent zebrafish larvae exhibited unchanged concentrations of lactate and TCA cycle intermediates succinate, fumarate and malate as opposed to mock-injected controls (Csingle bondD), thereby excluding hyperammonemia-induced metabolic alterations as cause of the observed neuronal phenotype. Data are expressed as mean +/− SD in μmol per g protein (A-D; whole body lysates, N = 3 with 50 larvae per group and experiment, Student's t-test). |

ASS1 deficiency is associated with a specific neuronal differentiation defect. At the 1-cell stage, wildtype or transgenic zebrafish larvae [tg(elavl3:eGFP) or tg(NBT/lyn:eGFP)] were either injected with ASS1-targeting MO or mock and subjected to ISH applying the indicated probes for mRNA detection (A-B, E-F) or in vivo imaging using a binocular fluorescence microscope (Csingle bondD, MZ16F, Leica) at 1 or 3 dpf. Lateral view with anterior to the left (A-F). ASS1-deficient zebrafish larvae exhibited reduced expression of pro-neuronal markers neurod1 and elavl3 at 1 and 3 dpf (A, B). Analogously, MO-injected transgenic zebrafish larvae expressing eGFP under control of the elavl3 promoter showed almost absent eGFP-expression at 1 dpf, which was partially restored at 3 dpf (C). However, ASS1-deficient tg(NBT/lyn:eGFP) transgenic zebrafish exhibited constantly reduced neuronal eGFP expression until 3 dpf as indicator of reduced neuronal cell mass (D). In contrast, glial cell markers gfap (astrocytes) and olig2 (oligodendrocytes) remained unchanged in response to ASS1 deficiency when compared to wildtype control (E, F). Important ISH-staining patterns are marked with arrow head(s) in the wildtype and MO-treated cohort (A, B, E, F). Distinct GFP-expression patterns of the transgenic tg(elavl3:eGFP) (C) or tg(NBT/lyn:eGFP) (D) zebrafish strains are marked with an asterisk in both cohorts. |
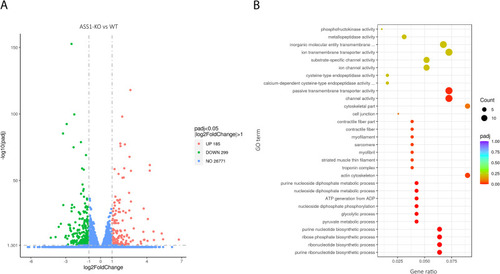
ASS1 deficiency is associated with distinct alterations of gene expression mainly involving (ribo)nucleotide metabolism and cerebral channels/receptors. Total RNA of mock- or MO-injected zebrafish larvae was extracted at developmental age 1 dpf using TRIzol reagent. RNA sequencing was commercially perfomed at Novogene Company Ltd. (UK) according to the service provider's protocols. (A) Volcano plot illustrating differentially expressed genes in ASS1-deficient (ASS1-KO) versus wildtype (WT) zebrafish larvae. Data are expressed in log2FoldChange (abscissa) and -log10(padj) (ordinate). Values for each gene with log2(FoldChange)| ≥ 1 and padj ≤0.05 were considered significant. Whereas the majority of 26,771 genes was not altered between both cohorts, 484 were significantly differentially expressed in ASS1-KO larvae with 185 genes being upregualted and 299 genes being downregulated. (B) Scatter plot of GO enrichment analysis in ASS1-KO zebrafish larvae depicting the ratio of the number of differentially expressed genes linked with a specific GO term to the total number of differential genes (abscissa) for the most significantly enriched GO terms (ordinate). The size of a point represents the number of genes annotated to a specific GO term, and the color grading from red to purple represents the level of significance of enrichment (padj). Alterations in gene expression in ASS1-deficient zebrafish larvae clustered in distinct (metabolic) pathways predominantly involving (ribo)nucleotide metabolism and cerebral channel/receptor expression. (For interpretation of the references to color in this figure legend, the reader is referred to the web version of this article.) |