
- Title
-
scMultiome analysis identifies embryonic hindbrain progenitors with mixed rhombomere identities
- Authors
- Kim, Y.I., O'Rourke, R., Sagerström, C.G.
- Source
- Full text @ Elife
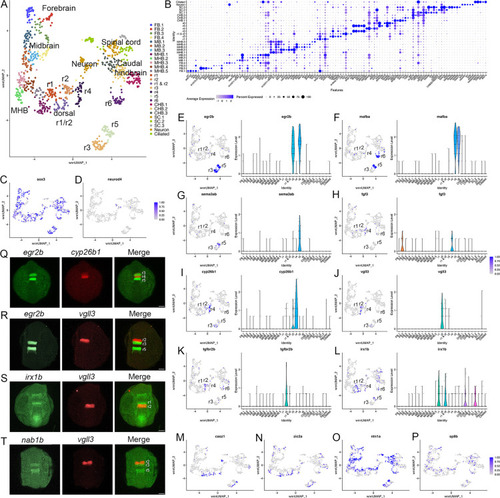
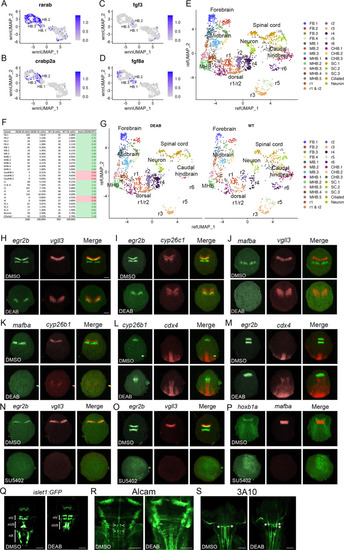
(A). UMAP of 13hpf neural clusters. (B). Dot plot showing the expression of the top five enriched genes in each cluster. (C, D). Feature plots showing the expressing of sox3 (C) and neurod4 (D). (E-L). Expression of rhombomere-specific genes are shown as feature plots (left panels) and violin plots (right panels). (M-P). Feature plots showing the expression of dorsoventral marker genes. (Q-T). Hybridization chain reaction (HCR) analysis of rhombomere-restricted gene expression in 13hpf wild-type zebrafish embryos. Embryos are shown in dorsal view with anterior to the top. FB = forebrain, MB = midbrain, MHB = midbrain-hindbrain boundary, r=rhombomere, CHB = caudal hindbrain, SC = spinal cord. Scale bar in (Q-T) = 100 um. |

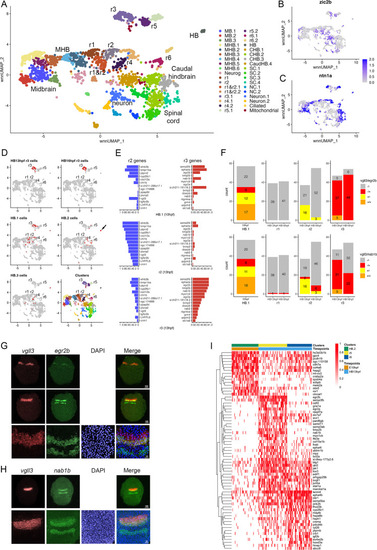
(A). UMAP showing all clusters obtained from 13hpf dissected zebrafish hindbrain regions. (B). Heatmap showing the expression of the top five enriched genes in each cluster. (C). Dot plot showing the expression of the top five enriched genes in each cluster. |
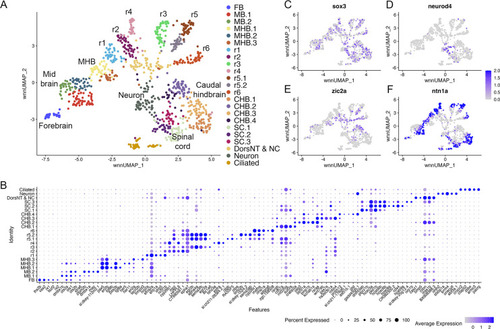
(A) UMAP of 16hpf neural clusters. (B) Dot plot showing the expression of the top five enriched genes in each cluster. (C, D) Feature plots showing the expressing of sox3 (C) and neurod4 (D). (E, F) Feature plots showing the expression of dorsoventral marker genes. dorsNT = dorsal neural tube, NC = neural crest. See legend to Figure 1 for additional abbreviations. |

( |
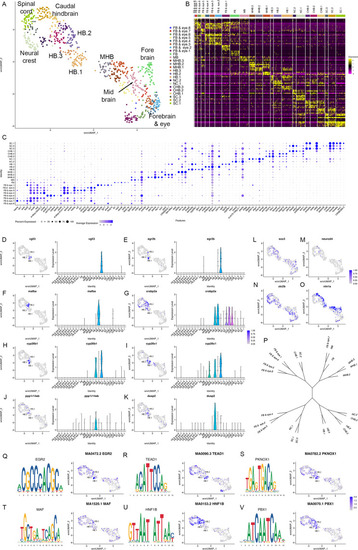
(A) UMAP of 10hpf neural clusters. (B, C) Heat map (B) and dot plot (C) showing the expression of the top five enriched genes in each cluster. (D-K) Expression of rhombomere-specific genes are shown as feature plots (left panels) and violin plots (right panels). (L-M) Feature plots showing the expressing of sox3 (L) and neurod4 (M). (N, O) Feature plots showing the expression of dorsoventral marker genes. (P) Dendrogram showing the relationship between the 10hpf neural clusters. (Q-V) Rhombomere-enriched accessible transcription factor binding motifs are shown as a motif logo (left panels) and as a feature plot of chromVar activity (right panel). HB = hindbrain, NC = neural crest. See legend to Figure 1 for additional abbreviations. |

scMultiome analysis of 10hpf zebrafish. ( |

Transcription factor binding motifs show rhombomere-restricted accessibility. See also |
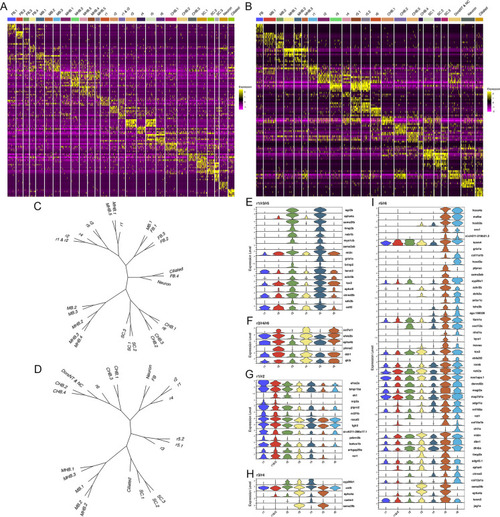
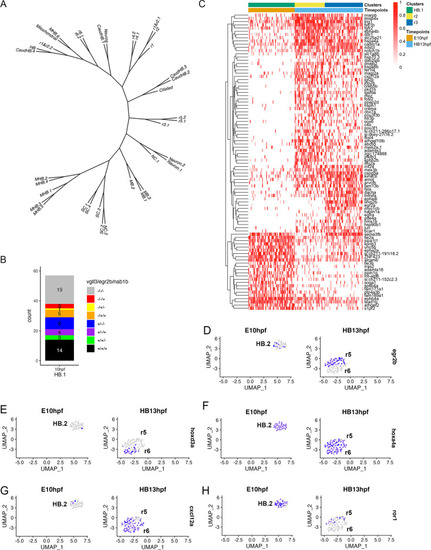
Each rhombomere displays a unique molecular profile. See also Figure 5—figure supplements 1–7. (A, B) Heat maps showing the expression of the top five enriched genes in each cluster at 13hpf (A) and 16hpf (B). Gene order in A and B is the same as in Figures 1B and 2B, respectively. (C, D). Dendrograms showing the relationship between each neural cluster at 13hpf (C) and 16hpf (D). ( E-I). Violin plots showing expression levels of genes enriched in odd (E) or even (F) rhombomeres, as well as genes enriched in adjacent pairs of rhombomeres (G–I), at 13hpf. |
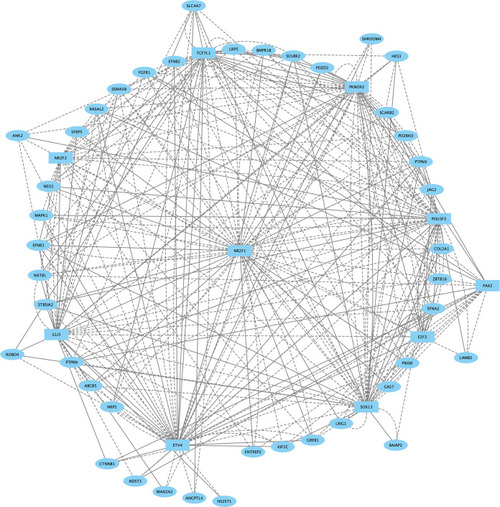
Direct-Net derived gene regulatory network for rhombomere 1 at 13hpf. TFs (squares) and non-TFs (ovals) are linked by the presence of accessible TF motifs within 500 bp (solid lines) or 250 kb (dashed lines) of a gene’s transcription start site. |

TFs (squares) and non-TFs (ovals) are linked by the presence of accessible TF motifs within 500 bp (solid lines) or 250 kb (dashed lines) of a gene’s transcription start site. |
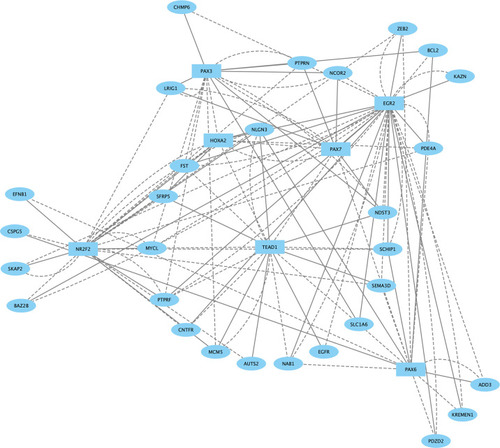
TFs (squares) and non-TFs (ovals) are linked by the presence of accessible TF motifs within 500 bp (solid lines) or 250 kb (dashed lines) of a gene’s transcription start site. |

TFs (squares) and non-TFs (ovals) are linked by the presence of accessible TF motifs within 500 bp (solid lines) or 250 kb (dashed lines) of a gene’s transcription start site. |
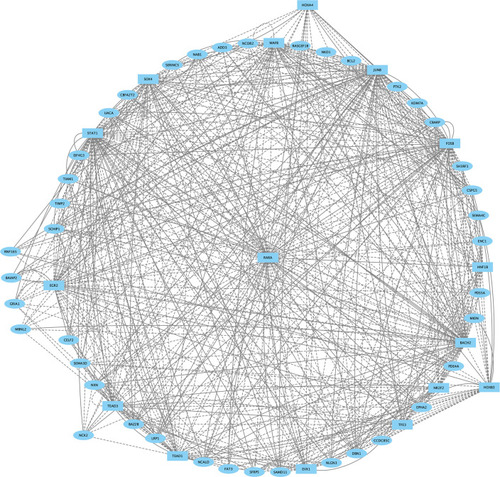
TFs (squares) and non-TFs (ovals) are linked by the presence of accessible TF motifs within 500 bp (solid lines) or 250 kb (dashed lines) of a gene’s transcription start site. Due to the large network produced for r5, only nodes with more than eight connections are shown. |

TFs (squares) and non-TFs (ovals) are linked by the presence of accessible TF motifs within 500 bp (solid lines) or 250 kb (dashed lines) of a gene’s transcription start site. |
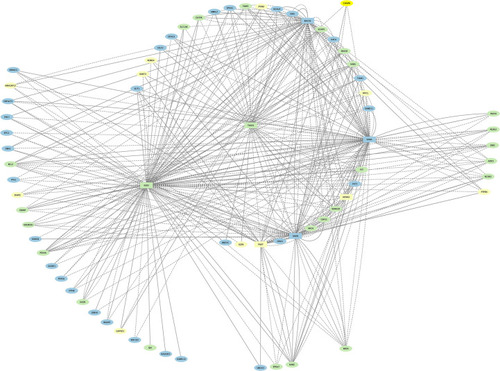
The Egr2 networks for r3 and r5 were computationally combined, and color-coded such that Egr2 nodes observed only in r3 are indicated in yellow, ones observed only in r5 are blue, and Egr2 nodes shared between r3 and r5 are green. TFs (squares) and non-TFs (ovals) are linked by the presence of accessible TF motifs within 500 bp (solid lines) or 250 kb (dashed lines) of a gene’s transcription start site. |
( |
( |
( |

( |
( |

An early ground state that lacks an anteroposterior pattern is proposed to respond to morphogens (fibroblast growth factor (Fgf) anteriorly and retinoic acid posteriorly) to generate three PHPDs. Each PHPD contains progenitor cells with mixed identities (HB.1=r1, r2, r3; HB.2=r5, r6, HB.3=r4) that are subsequently resolved via repressive TF interactions (red lines) into rhombomere cells with a single transcriptional identity. |