
- Title
-
Protocol for controlling visual experience during zebrafish development and modulation of motor behavior
- Authors
- Hageter, J., Starkey, J., Barr, A., Huff, J.R., Horstick, E.J.
- Source
- Full text @ STAR Protoc

Mounting incubator assembly (A) Representative diagram of complete mounting set up in incubator. (B) Deconstructed parts for mounting incubator. The top shelf is excluded. |

Behavior rig assembly (Stage mounts) (A) Complete behavior rig and blackout box. Forward views made transparent for visualization of the interior. (B) Individual stage mount construction using a 2 in. optical post (TR2) and an 8 in. optical post (TR8) along with the included 8–32 set screw. (C and D) (C) Breadboard (Thorlabs: MB1218) and stage set-up for behavior rig. Shows breadboard with stage mount assembly. (D) Inlay (blue) shows location of 3D printed stage holder placement for recording platform (HDPE material) stabilization. |
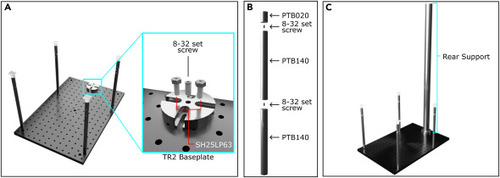
Rear support construction (A) The rear support baseplate (TR2) assembly is fastened to the breadboard using ¼”-20 low profile channel screws (SH25LP63 5/8″ length). Inlay (Cyan) depicts the location where screws should be inserted. An 8–32 set screw is inserted into the middle threads of the TR2 baseplate to fasten the rear support. (B) The rear support is constructed using two 1.5″ diameter, 14″ length, stainless steel posts (PTB140) and one 1.5″ diameter, 2″ length, stainless steel post (PTB020) using 8–32 set screws. (C) Representative of completed rear support post construction. |

Camera mount assembly (A) Camera mount assembly completed using two 6″ optical posts (TR6) inserted into a parallel clamp (RA360) and attached to the rear support with a 1.5″ diameter post mounting clamp with quick release handle (C1510). (B) Location where camera should be installed on the exposed end of the TR6 optical post for the camera mount. Inlay (blue) depict lens assembly. To the camera (UI-1540LE) attach a 1″ lens mount to hold the 12 mm C-mount camera lens. The 780 nm longpass filter (FGL780) is attached to the lens using an SM1 thread adapter (SM1A25). |

Light mount assembly (A) Representative light mount assembly installation. Colored boxed correspond with panels (B–E). (B) (Cyan) The 1.5″ optical post holder (PH1) is attached to the breadboard using an 8–32 set screw. This will hold the 12″ optical post (TR12). (C) (Green) The rotating clamp (TRB1) is attached to the tapered end of the 12″ optical post (TR12) depicted in (B) An An 8″ optical post (TR8) is attached to the other end of the rotating clamp. (D) (Magenta) The 8″ optical post depicted in (C) holds the rotating clamp (SWC/M) with a 6″ optical post attached to the open end. The complete assembly is oriented perpendicular to the 8″ optical post. (E) (Red) The LED assembly includes the LED (MCWHL5) connected to a 1″ diameter lens mount (LMR1S). To the lens mount, attach a 2″ tube lens with included retaining ring (SM1L20) and the 1″ HDPE cutout to the end to create diffuse illumination. |

T-Cube and DaqModule setup (A) Depiction of T-Cube LED controller (Thorlabs: LEDD1B). Plug in power source (Thorlabs: KPS201) to the indicated input. The LED gets plugged into “LED in”. To the center plug attach the BNC connection with a positive (+) red wire and negative (-) black wire. (B) Representative of DaqModule (National Instruments: USB-6001) pinouts. The positive wire plugs into the pin 1 port (P0.1) and the negative to the digital ground port (D GND). Refer to the pinout diagram included with the DaqModule to ensure correct placement. |

IR and stage placement (A) Representative depiction of the infrared light placement (CMVision: CM-IR130-940M) centered among the four stage mounts. (B) Representative image of HDPE (McMaster Carr: 8619K441) stage placement set in 3D printed stage holders attached to the stage mounts. |

Setting equal contrast behavior arena (A) Camera image obtained from running “173_setparams_multiplex” script representing desired contrast. Numbered circles indicate regions clicked denoted in the console window. Regions clicked indicate x and y coordinates along with the gray value for the pixel clicked. |

Embedding larvae in LMP agarose (A) Representative image of dechorionating process by using microdissection forceps to pull apart chorion so larvae can swim away freely. (B) Schematic of multiple larvae mounted in a single direction (Right side down) after anaesthetizing in 1% tricane (Millipore: E10521). (C) Embedded larve are moved to the prepared mounting incubator. (Refer to “Before you begin” steps 8–13). (D) Representative of removing larvae from agar using microdissection forceps. Inlay (red) shows recommended agar cut location (Magenta dotted line) to free larvae from the agar. (E) Location of agar removal (magenta) for embedding from 4-6 dpf to allow for adequate oxygen and ion exchange during mounting. (F) Lethality of mounting for unmounted control (N = 175) and mounted (N = 198) larvae. Controls were anesthetized for the same duration as mounted individuals, but not embedded in LMP agarose following. Lethality counts were collected at 7 dpf. (G) Same experiment as in (F) examining swim bladder inflation rates. Overinflated represents individuals who float at the surface of the water, underinflated represents individuals who cannot maintain buoyancy, and normal inflation consists of individuals who can freely swim throughout the water column. |

Behavior tracking (A and B) (A) True perspective of dish orientation with labels used in analysis and (B) camera view for the same quadrants. (C) Eventtimer.sav layout identifying major components of the behavior tracking script. |

Cplot data analysis (A) This is the window that appears when you open Cplot. Areas highlighted in red must use the value depicted in the figure. Image size set to 980 because the camera is opened to view a 980 × 980 pixel window when tracking larvae. Expected points per file is set to 290 because tracking 10 points per second for 29 s produces 290 points. Minimum points per file is set to 100 because tracking files where less than 100 points were acquired should be excluded. Trace size is set to 10 as this is an interpolation distance used to calculate metrics obtained later in the protocol (See step 35). Cyan inlay depicts the “Location inside” values needed to input for specific quadrants when analyzing data (See step 38). |

Batchan data analysis (A) This is the window that appears when you open Batchan. At the top menu, select Tools then Reorder rows/cols to see the box depicted in the inlay (red). |
|