
- Title
-
Investigating the role of lipid genes in liver disease using fatty liver models of alcohol and high fat in zebrafish (Danio rerio)
- Authors
- Shihana, F., Cholan, P.M., Fraser, S., Oehlers, S.H., Seth, D.
- Source
- Full text @ Liver Int.

Survival and gene expression analysis in crispant zebrafish larvae. (A) gene expression (B) mortality of pnpla3, faf2 and tm6sf2. Each bar is with three repeated experiments (clutch, 15–20 larvae in each clutch). *Indicates p < .05 crispant-fold change compared to scramble control as 1 using non-parametric Mann–Whitney test. (C) Brightfield images from live Tg(lyzC:gfp)nz117 showing a range of developmental morphological abnormalities in pnpla3, faf2 and tm6sf2 crispants with 2% EtOH exposure |
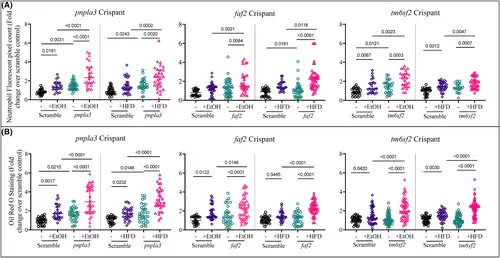
Ethanol or HFD exposure increased liver neutrophil and lipid accumulation. (A) ORO staining showing lipid deposit in the zebrafish larva liver. (B) Quantification of neutrophil recruitment in liver (A) quantification of lipid accumulation (B) using Oil Red O staining after exposure to 2% EtOH or HFD for 48 h in pnpla3, faf2 and tm6sf2 crispants. Y-axis represents the foldchange over scramble control. Ordinary one-way ANOVA test was used to compare between respective groups. |
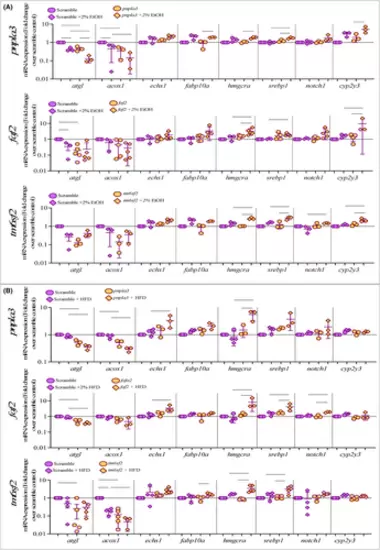
Ethanol or HFD exposure altered expression of genes in lipid biology pathways in zebrafish larvae. Lipid biology genes expression in pnpla3, faf2 and tm6sf2 crispants on 5 dpf following 48 h of exposure to (A) 2% EtOH or (B) HFD. qPCR analysis was used to detect the expression of lipid-related genes relative to 18S. The average fold change was normalised to the expression in scramble control. Y-axis represents the foldchange over scramble control (marked in dotted line). Each point represents data pooled from10 to 15 zebrafish larvae per treatment. Error bars indicate interquartile range of the median. The ordinary one-way ANOVA with selected pair test was used to calculate the statistical significance. |

Live imaging of Nile Red and Nile Blue staining in pnpla3, faf2 and tm6sf2 crispants treated with ethanol/HFD exposure developed lipid droplets and free fatty acids. Live images show crispants (A) pnpla3 (B) faf2 and (C) tm6sf2 treated with 2% EtOH or HFD and stained with Nile Red (magenta) and Nile Blue (cyan) using confocal microscopy. A z-stack of 75 μm was compiled for each sample. Highlighted region (orange line) is the liver of each zebrafish larvae. Images were used to quantify lipid (magenta fluorescence intensity), and free fatty acid (cyan fluorescence intensity) content using Fiji ImageJ software. Bar chart (D) shows the amount of lipid and free fatty acids florescence count in each crispants. A set of 4–6 larvaewere used for the image analysis. |

Nile Red staining showed larger size lipid droplets in 2% ethanol- or HFD-treated crispants. (A) Representative images show the liver area selected to calculate the lipid droplets size count in pnpla3, faf2 and tm6sf2 crispants treated with HFD, stained with Nile Red (magenta) and imaged using confocal microscopy. (B) Percentage of number of lipid droplet size (μm2), 1–10, 10–50 and greater 50 was measured using Fiji ImageJ software in scramble control and pnpla3, faf2 and tm6sf2 larvae on 5 dpf following 48 h of exposure to 2% EtOH and HFD. |