FIGURE SUMMARY
Title

Acute stress modulates social approach and social maintenance in adult zebrafish

Authors
Cook, A., Beckmann, H., Azap, R., Ryu, S.
Source
Full text @ eNeuro

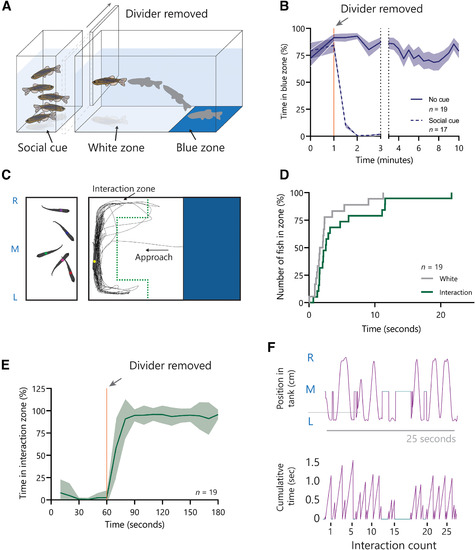
A novel social behavior assay distinguishes between social approach and social maintenance behaviors. A, A 3D schematic representation of the social assay experimental setup with a divider obstructing the visual social cue. B, Preference for the blue zone (%) with or without the divider blocking the visual access to social cues in 30-s bins. C, A 2D schematic representation from the top view demonstrating typical traces of the test fish. The interaction zone is marked by the green dotted line. D, A plot showing the time of the first entry of each fish to the white zone and subsequently to the interaction zone. Each event represents an individual’s first entry to each zone, displayed as a percentage of the population (%). E, Time spent in the interaction zone with the divider (60 s) or without the divider (120 s) as a percentage (%) of 30-s bins. F, The position of the test fish on the L-R axis during a typical 25-s period demonstrating stereotypical social interaction behavior. The cumulative time for each interaction is plotted demonstrating the typical duration and the frequency of interactions. Extended Data Figures 1-1, 1-2, and 1-3 are available to support this figure. Abbreviations: R, right; M, middle; L, left.

Social approach and social maintenance behaviors are modulated by the salience of the social cue. A, Social approach behavior (normalized white zone preference and interaction zone latency) with TU (same as test fish), Casper, or TL fish as the social cue. B, Social maintenance behavior (normalized time in the interaction zone and interaction count) with different strains as conspecifics. C, Social approach behavior with zero, one, or five fish as the social cue. D, Social maintenance behavior with different numbers of fish as the social cue. E, The distance to the nearest fish is measured between the test fish and the nearest fish on the L-R axis that is within the 1-cm proximity zone (gray vertical dashed line). The distance to the nearest fish is plotted in histograms for when the test fish is in the interaction zone and when it is not in the interaction zone. F, The distance to the nearest fish on the L-R axis plotted in a histogram for when the test fish is not in the interaction zone. Error bars denote the mean ± 1 standard deviation (SD); significant post hoc comparisons, ns P > 0.05; *P < 0.05, **P < 0.01; ***P < 0.001. Abbreviations: TU, Tübingen; TL, Tupfel Long-fin.

The LD stimulus presentation allows delivery of graded acute stress exposure. A, The LD stimulus is presented on a monitor above the fish and each LD event lasts 4.8 s. B, The LD is presented after a 30-s pre-LD phase and is then repeated 6, 12, or 18 times. A 30-s recovery phase is subsequently recorded. C, The average speed during the LD phase for each intensity (cm/s). D, Cumulative distance swum (cm) during the LD presentation for all LD groups. Excess distance (cm) is the δ between 0 LD and the cumulative distance at each LD number (6, 12, 18). E, The number of turns (turns per second) during the first 6 LD in the 6LD, 12 LD, and 18 LD group compared with the pre-LD phase. F, Correlation between excess distance swum (cm) and the number of LD presented. G, Correlation between time spent immobile (%) for the 60-s post-LD exposure and the number of LD presented. H, Correlation between whole-body cortisol (μg/g) measured 15 min after LD exposure and the number of LD presented. Extended Data Figures 3-1 and 3-2 are available to support this figure. Error bars denote the mean ± 1 standard deviation (SD); significant post hoc comparisons and slope significance, **P < 0.01; ***P < 0.001. Abbreviations: LD, looming dot.

Social maintenance is modulated at a lower acute stress intensity than social approach. A, Time spent in the white zone (%) with the visual divider present (presocial) and while the social cue is visible (social) and the difference (δ) for each LD group. B, Correlation between the time in the white zone δ (%) and the number of LD presented. C, The number of fish (%) arrived in the interaction zone for each LD group following the removal of the divider. D, Example traces from above of a 0 LD and an 18 LD fish during the social phase and a 25-s example of the fish’ movement in the interaction zone on the L-R axis over time demonstrating the frequency of social interactions. E, Correlation between the time spent in the interaction zone (%) and the number of LD presented. F, Correlation between the number of interactions performed and number of LD fish were exposed to. G, Covariance coefficient matrix for each behavior categorized into endocrinological measures, escape behaviors, social approach and social maintenance. Covariance was measured across all treatment groups. H, Social approach and social maintenance measures normalized to basal for each LD intensity. Extended Data Figures 4-1, 4–2, and 4-3 are available to support this figure. Error bars denote the mean ± 1 standard deviation (SD); significant post hoc comparisons and slope significance, ns P > 0.05, *P < 0.05 ,**P < 0.01; ***P < 0.001. Abbreviations: LD, looming dot.

Acknowledgments
This image is the copyrighted work of the attributed author or publisher, and ZFIN has permission only to display this image to its users. Additional permissions should be obtained from the applicable author or publisher of the image. Full text @ eNeuro