
- Title
-
Fluid extraction from the left-right organizer uncovers mechanical properties needed for symmetry breaking
- Authors
- Sampaio, P., Pestana, S., Bota, C., Guerrero, A., Telley, I.A., Smith, D., Lopes, S.S.
- Source
- Full text @ Elife

Manipulated embryos develop normal LRO cilia evaluated by immunofluorescence. Cilia number, length and anterior-posterior ratio of cilia distribution in WT and fluid extracted embryos – ( |

Manipulated embryos develop normal LRO cilia evaluated by immunofluorescence. Cilia number, length and anterior-posterior ratio of cilia distribution in WT and fluid extracted embryos – ( |

Cilia Beat Frequency and motile/ immotile cilia ratio do not change in manipulated embryos evaluated by live imaging. ( |

LRO areas from recovering embryos that develop left-right defects are not different from embryos that have a normal development. ( |

Angular velocity during LRO fluid flow recovery. Angular velocity polar plots for 6 ss, 7 ss, and 8 ss for the three different groups (A) 'Sham’ control embryos colour coded in green, (B) ‘No LR Defects’ group of embryos colour coded in blue and (C) 'LR Defects’ group of embryos colour coded in red. LR defects refer to misplacement of heart or liver encountered at the larval stage after fluid extraction was performed at 5 ss; number of tracks refers to the number of particle trajectories identified for the quantifications and respective angular velocity plots. Colour code on polar plots refers to the median angular velocity for pooled embryos. (D–E) Violin plots showing quantifications of angular velocities found for the tracks analysed (D) anterior-posterior and (E) left and right. Dots contained in the violin plots correspond to median values per embryo. A statistical linear mixed effects regression was applied (see results in Table 1). |
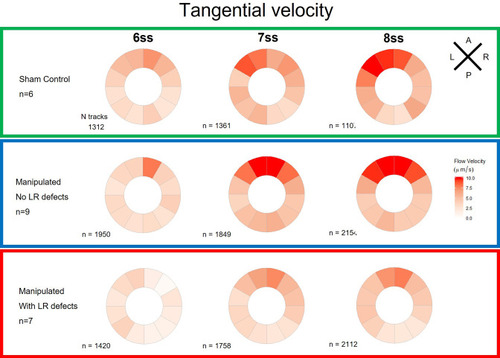
Tangential velocity component of particle movement in the outer LRO luminal space. Tangential velocity polar plots for 6 ss, 7 ss, and 8 ss for the three |

Radial velocity components of particle movement in the outer KV luminal space during fluid recovery. Radial velocity polar plots from the outermost area of the KV (radius > 0.5 for a maximum of 1) are at 6ss, 7ss. and 8ss are represented for the three different groups (‘Sham’ control, ‘Defects’ and ‘No Defects’ group) – number of tracks refers to the number of particle trajectories identified for the quantifications and respective velocity plots. Colors on circular plots refer to the median velocity component for all pooled embryos. Positive radial components indicate predominant flow movement towards the KV surface. ss: somite stage. |

Directionality of vector fields changes in embryos that develop LR defects. (A) Diagram representing particle directionality. LRO area sections were delimited based on intervals of 30 degrees. Highlighted are regions (B) from 30 to 60 degrees and (C) 60–90 degrees, that showed significant differences in particle movement between the groups ‘Sham’ control embryos and embryos with ‘LR Defects’. Each density plot represents the pooled tracked trajectory of all moving particles at any given point in time. Respective area region analysed is represented on the top right corner of each plot. To assess differences upon fluid manipulation ‘Sham’ and ‘Defect’ groups were plotted for the 6 ss. Kolmogrov-Smirnov test was used for comparing trajectory distribution between the two groups. Full data can be found in Figure 3—figure supplements 1–6. |

Particle movement direction at different regions of the LRO for ‘Sham’ and ‘No Defects’ groups at 6 ss. Each plot represents the pooled tracked trajectory of a moving particle at even given point in time. Trajectories were plotted from the outermost area of the LRO (radius > 0.5 from a maximum of 1). Kolmogorov-Smirnov test was used from comparing trajectory distribution between the two groups. ss: somite stage. LRO: left-right organizer. |

Particle movement direction at different regions of the LRO for ‘Sham’ and ‘No Defects’ groups at 7 ss. Each plot represents the pooled tracked trajectory of a moving particle at even given point in time. Trajectories were plotted from the outermost area of the KV’s (radius > 0.5 from a maximum of 1). Kolmogrov-Smirnov test was used from comparing trajectory distribution between the two groups. ss: somite stage; LRO: left-right organizer. |

Particle movement direction at different regions of the LRO for ‘Sham’ and ‘No Defects’ groups at 8ss. Each plot represents the pooled tracked trajectory of a moving particle at even given point in time. Trajectories were plotted from the outermost area of the KV’s (radius > 0.5 from a maximum of 1). Kolmogorov-Smirnov test was used from comparing trajectory distribution between the two groups. ss: somite stage. LRO: left-right organizer. |

Particle movement direction at different regions of the KV for ‘Sham’ and ‘Defects’ groups at 6 ss. Each plot represents the pooled tracked trajectory of a moving particle at even given point in time. Trajectories were plotted from the outermost area of the KV’s (radius > 0.5 from a maximum of 1) Kolmogorov-Smirnov test was used from comparing trajectory distribution between the two groups. ss: somite stage. LRO: left-right organizer. |

Particle movement direction at different regions of the LRO for ‘Sham’ and ‘Defects’ groups at 7 ss. Each plot represents the pooled tracked trajectory of a moving particle at even given point in time. Trajectories were plotted from the outermost area of the KV’s (radius >0.5 from a maximum of 1). Kolmogorov-Smirnov test was used from comparing trajectory distribution between the two groups. ss: somite stage. LRO: left-right organizer. |

Particle movement direction at different regions of the LRO for ‘Sham’ and ‘Defects’ groups at 8 ss. Each plot represents the pooled tracked trajectory of a moving particle at even given point in time. Trajectories were plotted from the outermost area of the KV’s (radius >0.5 from a maximum of 1). Kolmogorov-Smirnov test was used from comparing trajectory distribution between the two groups. ss: somite stage. LRO: left-right organizer. |

LRO flow dynamics is only affected when fluid dilution alters fluid viscosity ( Number of tracks refers to the number of particle trajectories identified for the quantifications and respective angular velocity plots. Colour code on polar plots refers to the median angular velocity for all pooled embryos. LRO: left-right organizer. DB: Danieau buffer. MC: methylcellulose. |

LRO flow dynamics is only affected when fluid dilution alters fluid viscosity ( Number of tracks refers to the number of particle trajectories identified for the quantifications and respective angular velocity plots. Colour code on polar plots refers to the median angular velocity for all pooled embryos. LRO: left-right organizer. DB: Danieau buffer. MC: methylcellulose. |

LRO fluid content does not affect left-right development. ( |

Mixed effects model fits for the distributions of anterior angular velocity to ( Central line is fixed effect, outer pairs of lines are +/-1 and+/-2 standard deviations in normally distribution random effects. ss: somite stage. |

Mixed effects model fits for the distributions of anterior angular velocity to ( Central line is fixed effect, outer pairs of lines are +/-1 and+/-2 standard deviations in normally distribution random effects. ss: somite stage. |

Anterior angular velocity distributions for all modelled experimental interventions. ( |

3D smFISH and spatial analysis of ( |