
- Title
-
The ndrg2 Gene Regulates Hair Cell Morphogenesis and Auditory Function during Zebrafish Development
- Authors
- Wang, C., Wang, X., Zheng, H., Yao, J., Xiang, Y., Liu, D.
- Source
- Full text @ Int. J. Mol. Sci.
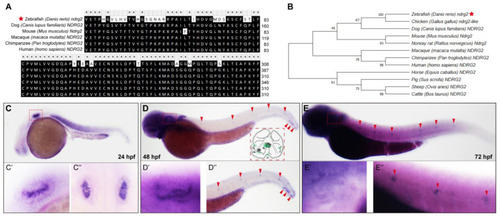
The |
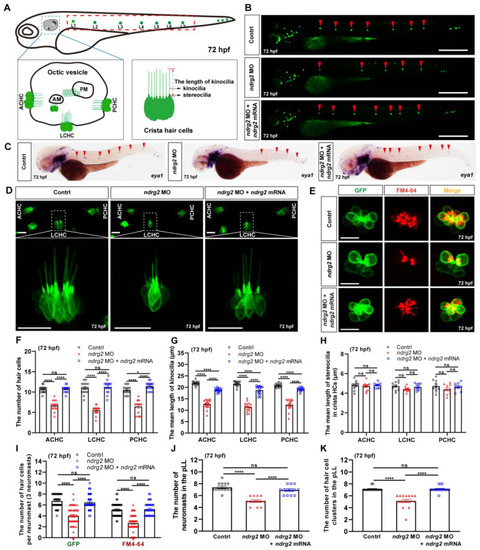
Knockdown of the |

Knockdown of the |
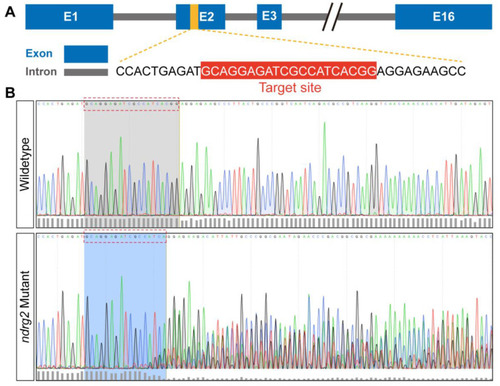
CRISPR/Cas9-mediated |

Knockout of the |
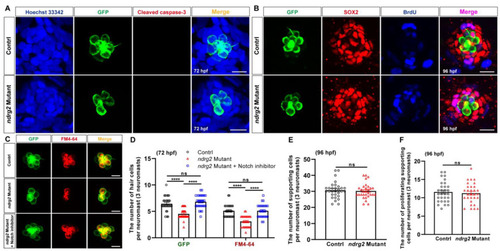
Loss of the |