
- Title
-
Simple Coumarins from Peucedanum luxurians Fruits: Evaluation of Anxiolytic Activity and Influence on Gene Expression Related to Anxiety in Zebrafish Model
- Authors
- Widelski, J., Kasica, N., Maciąg, M., Luca, S.V., Budzyńska, B., Fondai, D., Podlasz, P., Skalicka-Woźniak, K.
- Source
- Full text @ Int. J. Mol. Sci.

Chemical structures of isolated coumarins. |
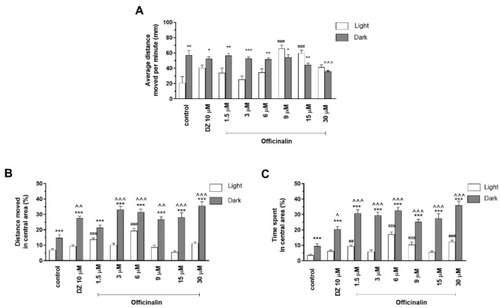
The effects of officinalin (1.5, 3, 6, 9, 15, and 30 µM) and diazepam (DZ, 10 µM) on locomotor activity during all three light–dark challenge phases. (A) Average distance moved by zebrafish larvae within each 1 min time bin under either light (open bars) or dark (filled bars). (B) The percentage of distance moved by zebrafish larvae in the central area during the light phase (white bars) or dark phase (filled bars). (C) The percentage of time spent by zebrafish larvae in the central area during the light phase (white bars) or dark phase (filled bars). Data are presented as mean ± SEM; n = 32. * p < 0.05, ** p < 0.01, *** p < 0.001 in comparison to light conditions within the same concentration group; ^ p < 0.05, ^^ p < 0.01, ^^^ p < 0.001 in comparison to control group under dark condition; ## p < 0.01, ### p < 0.001 in comparison to control group under light condition (post hoc Bonferroni’s test). |

The effects of stenocarpin isobutyrate (1.5, 3, 6, 9, 15, and 30 µM) and diazepam (DZ, 10 µM) on locomotor activity during all three light–dark challenge phases. (A) Average distance moved by zebrafish larvae within each 1 min time bin under either light (open bars) or dark (filled bars). (B) The percentage of distance moved by zebrafish larvae in the central area during the light phase (white bars) or dark phase (filled bars). (C) The percentage of time spent by zebrafish larvae in the central area during the light phase (white bars) or dark phase (filled bars). Data are presented as mean ± SEM; n = 32. ** p < 0.01, *** p < 0.001 in comparison to light conditions within the same concentration group; ^ p < 0.05, ^^ p < 0.01, ^^^ p < 0.001 in comparison to control group under dark condition; # p < 0.05, ## p < 0.01, ### p < 0.001 in comparison to control group under light condition (post hoc Bonferroni’s test). |

The effects of officinalin isobutyrate (1.5, 3, 6, 9, 15, and 30 µM) and diazepam (DZ, 10 µM) on locomotor activity during all three light–dark challenge phases. (A) Average distance moved by zebrafish larvae within each 1 min time bin under either light (open bars) or dark (filled bars). (B) The percentage of distance moved by zebrafish larvae in the central area during the light phase (white bars) or dark phase (filled bars). (C) The percentage of time spent by zebrafish larvae in the central area during the light phase (white bars) or dark phase (filled bars). Data are presented as mean ± SEM; n = 32. * p < 0.05, ** p < 0.01, *** p < 0.001 in comparison to light conditions within the same concentration group; ^ p < 0.05, ^^ p < 0.01, ^^^ p < 0.001 in comparison to control group under dark condition; # p < 0.05; ## p < 0.01 in comparison to control group under light condition (post hoc Bonferroni’s test). |
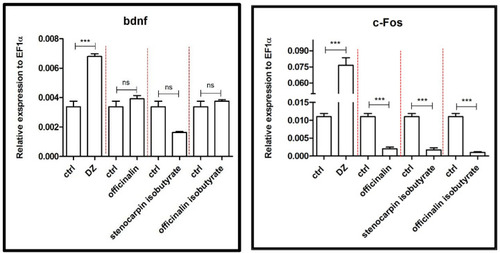
Expression profiles of bdnf and c-fos genes associated with neuronal activity after exposure to 10 µM concentration of diazepam and 6 µM concentration of tested coumarins. Data are presented as mean ± SEM; *** p < 0.001 in comparison to the control group. |

Expression profiles of gabarapa and gabarapb genes associated with GABA-ergic system after exposure to 10 µM concentration of diazepam and 6 µM concentration of tested coumarins. Data are presented as mean ± SEM; * p < 0.05; *** p < 0.001 in comparison to the control group. |

Expression profile of gal gene associated with galaninergic system after exposure to 10 µM concentration of diazepam and 6 µM concentration of tested coumarins. Data are presented as mean ± SEM; * p < 0.05; *** p < 0.001 in comparison to the control group. |
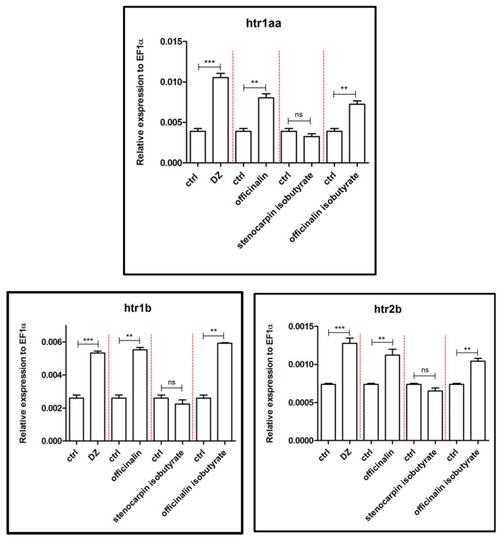
Expression profiles of htr1Aa, htr1b, and htr2b genes associated with the serotoninergic system after exposure to 10 µM concentration of diazepam and 6 µM concentration of tested coumarins. Data are presented as mean ± SEM; ** p < 0.01; *** p < 0.001 in comparison to the control group. |

Expression profiles of penka and penkb genes associated with the enkephalinergic system after exposure to 10 µM concentration of diazepam and 6 µM concentration of tested coumarins. Data are presented as mean ± SEM; ** p < 0.01; *** p < 0.001 in comparison to the control group. |

Expression profiles of th1 genes associated with the dopaminergic system after exposure to 10 µM concentration of diazepam and 6 µM concentration of tested coumarins. Data are presented as mean ± SEM; ** p < 0.01; *** p < 0.001 in comparison to control group. |