- Title
-
The regeneration-responsive element careg monitors activation of Müller glia after MNU-induced damage of photoreceptors in the zebrafish retina
- Authors
- Bise, T., Pfefferli, C., Bonvin, M., Taylor, L., Lischer, H.E.L., Bruggmann, R., Jaźwińska, A.
- Source
- Full text @ Front. Mol. Neurosci.
|
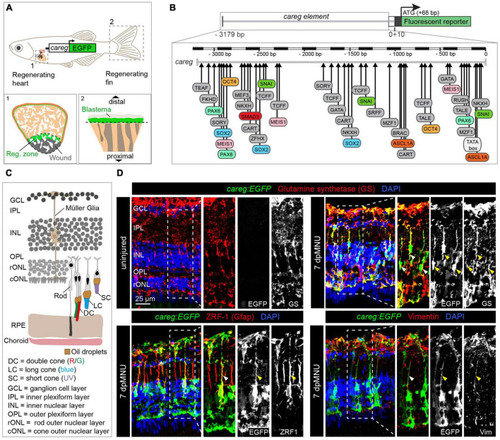
The careg regulatory element is activated in Müller glia during retina regeneration. (A) Schematic representation of the transgenic zebrafish line carrying the careg regulatory element upstream of the EGFP reporter, based on Pfefferli and Jaźwińska (2017). The careg:EGFP transgene is activated during heart (1) and fin (2) regeneration. (B) Prediction of transcription factor binding sites in the careg sequence with MatInspector (Genomatix) (Pfefferli and Jaźwińska, 2017). (C) Schematic representation of the retina in adult zebrafish, with an illustration of photoreceptors, based on Raymond and Barthel (2004) and Lagman et al. (2015). Outer segments of cones are colored according to their spectral sensitivity. Abbreviations are listed on legend at the bottom of the drawing. (D) Immunofluorescence stained sections of uninjured and 7 days post-MNU treatment (dpMNU) retinas of careg:EGFP (green) transgenic fish using three Müller glia markers (red): glutamine synthetase (GS), vimentin and the glial fibrillary acidic protein (GFAP, visualized with ZRF-1 antibodies). Nuclei are stained with DAPI (blue). In uninjured retina, no careg:EGFP is detected. At 7 dpMNU, careg:EGFP partially overlaps with some cells expressing GS, GFAP, and vimentin (arrowheads). In this, and all subsequent figures, a dashed frame demarcates the magnified area shown in adjacent panels. N ≥ 3 (number of fish). |
|
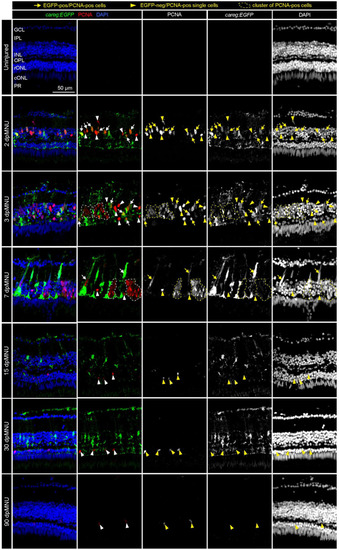
Proliferative cells of regenerating retinas include careg:EGFP-positive cells with an elongated nuclei. Sections of careg:EGFP (green) retinas, immunostained for the G1/S-phase cell cycle marker PCNA (red) and the nuclear marker DAPI (blue). Expression of careg:EGFP (green) is absent in the uninjured retina, but it is induced at 2 dpMNU and persists until 30 dpMNU. In the inner nuclear layer (INL), EGFP/PCNA double positive cells with an elongated nucleus (arrows) can be observed at 2, 3, and 7 dpMNU. Single EGFP-negative and PCNA-positive cells with roundish nuclei (arrowheads) are observed at all time-points after injury. Clusters of EGFP-negative and PCNA-positive cells (encircled with a dashed line) correspond to progenitor cells at 3 and 7 dpMNU. At 15 and 30 dpMNU, PCNA-positive cells are present in the outer nuclear layer (ONL). At 90 dpMNU, no EGFP-positive cells are detected. GCL, ganglion cell layer; IPL, inner plexiform layer; INL, inner nuclear layer; OPL, outer plexiform layer; rONL, rod outer nuclear layer; cONL, cone outer nuclear layer; PRL, photoreceptors layer. N ≥ 3 (number of fish). |
|
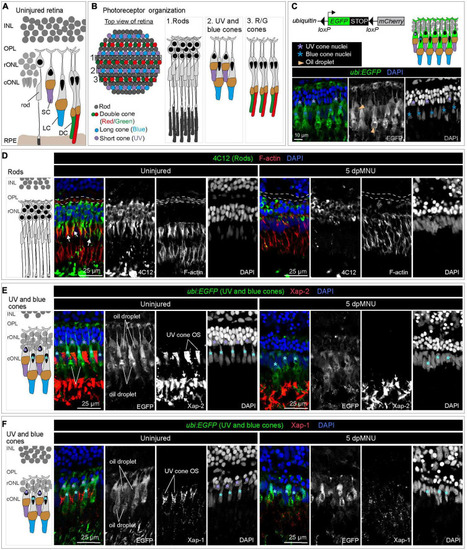
MNU-mediated injury predominantly affects rods, UV-cones and the outer plexiform layer. Schematics of photoreceptor organization in a transversal section (A) and frontal flattened view (B), based on Raymond and Barthel (2004), Lagman et al. (2015), and Noel et al. (2021). INL, inner nuclear layer; rONL, rod outer nuclear layer; cONL, cone outer nuclear layer; OPL, outer plexiform layer; RPE, retinal pigmented epithelium; DC, double cones (red/green spectral sensitivity); LC, long single cones (blue spectral sensitivity); SC, short single cone (UV spectral sensitivity). (C) Ubiquitin-promoter driven loxP-EGFP-loxP-mCherry transgene is expressed in blue and UV cones. Top panel shows a schematic illustration and the bottom panel displays a section of uninjured retina with ubi:EGFP transgene expression (green) and DAPI (blue). (D) Transversal retinal section stained with 4C12 antibody to visualize cell bodies and inner segments of rods (green), Phalloidin to detect F-actin (red) and DAPI (blue). In uninjured retina, colocalization between 4C12 and Phalloidin (arrows) is detected at the level of inner segments. F-actin is also present in the photoreceptor processes in the outer plexiform layer (outlined with a dashed lines). At 5 dpMNU, F-actin in the outer plexiform layer is missing and rod cells bodies and their inner segments are disorganized. (E) Identification of Xap-2 antibody (red) as a marker of photoreceptor outer segments on section of ubi:EGFP transgenic retinas. A strong expression is detected distally to the oil droplet in the UV cones (purple asterisks) and blue cones (cyan asterisks). (F) Identification of Xap-1 antibody (red) as a marker of the cone outer segment on section of ubi:EGFP transgenic retinas. A dotty localization of Xap1 is enriched distally to the oil droplet in the UV cones (purple asterisks). Dots of Xap-1 labeling are also observed in the outer segments of other photoreceptors, but at much less concentrated level. N ≥ 3. |
|
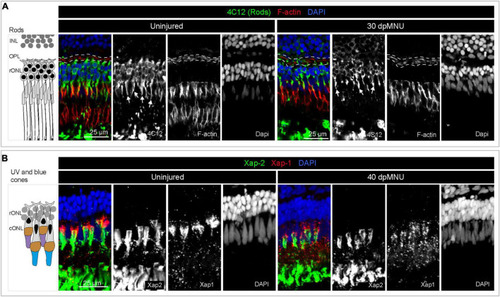
Restoration of rods and UV cones after MNU-injury. (A) Schematic illustration and sections of intact and 30 dpMNU retinas immunostained against the rod marker 4C12 (green), the F-actin marker Phalloidin (red) and DAPI (blue). The distribution of rods (4C12, green) and synaptic processes of the OPL (encircled with a dashed line) are restored at 30 dpMNU. (B) Schematic illustration and sections of intact and 40 dpMNU retinas immunostained with Xap-2 (green), Xap-1 (red) antibodies, and DAPI (blue). The outer segment of UV-cones is restored at 40 dpMNU. INL, inner nuclear layer; OPL, outer plexiform layer; rONL, rod outer nuclear layer; cONL, cone outer nuclear layer. N = 3. |
|
scRNA sequencing of careg:EGFP regenerating adult zebrafish retinas following MNU chemical injury. (A) Experimental design of retina isolation used for scRNA-sequencing. (B) Transversal sections of uninjured and regenerating careg:EGFP retinas at 3 days after treatment with harmful or inactivated MNU. careg:EGFP expression (green) is not detected after treatment with inactivated MNU, suggesting absence of injury. N = 3. (C) UMAP plots of the integrated cell RNA-sequencing data showing cluster assignments for each cell type collected from control and post-MNU treated retinas. (D) Dot plot showing expression of canonical markers for all retina cell types. Dot size indicates the proportion of cells expressing the corresponding gene and the color gradient indicates the average expression levels. (E) Histogram displaying percentage of cells in each cluster per time-point. |
|
Transcriptome dynamics of immature and mature rods following MNU chemical injury. (A) UMAP plot of merged datasets showing the rod clusters in color and other cell clusters in gray. (B) Dot plot displaying differential expression levels of three pairs of paralogous genes of the rod identity in cluster A and B. (C,D) Selected Gene Ontology terms of upregulated genes in each rod cluster. Complete data are in Supplementary Table 4. (E) Heatmap of selected genes that display differential expression between both rod clusters. Complete data are in Supplementary Table 4. (F) Volcano plots of DEGs within each of rod clusters between 3 dpMNU compared to uninjured control. Complete data are in Supplementary Tables 5, 6. |
|
Transcriptome dynamics of UV and non-UV cones following MNU chemical injury. (A) UMAP plot of merged datasets showing the cone clusters in color and other cell clusters in gray. (B) Heatmap of opsin-1 genes in cone clusters. Complete data are in Supplementary Table 7. (C) A three-color scale used to indicate expression levels in heatmaps in panels (B,D). (D) Heatmap of selected genes in cone clusters. Complete data are in Supplementary Table 7. (E) Volcano plots of DEGs within each of cone clusters between 3 dpMNU compared to uninjured control. Complete data are in Supplementary Tables 8, 9. (F) Selected Gene Ontology terms of upregulated genes in each cone cluster. Complete data are in Supplementary Tables 8, 9. |
|
careg:EGFP is expressed in a subpopulation of Müller glia after MNU injury. (A) UMAP plots showing the distribution of careg:EGFP-positive cells (green) per condition. (B) Bar plot showing numbers of careg:EGFP-positive cells per time-point. (C) Histogram displaying the proportion of careg:EGFP-positive cells per cluster in the integrated cell RNA-sequencing data. (D) UMAP plot showing the distribution of the Müller glia cluster cells (orange) in the integrated scRNA-seq data. (E) A heatmap of differential gene expression analysis in careg:EGFP-positive cells compared to EGFP-negative cells within the Müller glia cluster. Complete data are in Supplementary Table 10. |
|
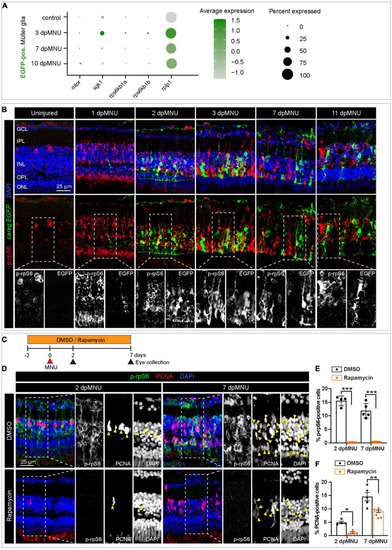
The careg element is transiently associated with phospho-rpS6-immunoreactive cells in regenerating retina. (A) Dot plot displaying differential expression levels of mtor and its downstream signaling components encoding ribosomal proteins in careg:EGFP-positive and careg:EGFP-negative Müller glia at different conditions. (B) careg:EGFP retina sections at different time-points post-MNU-treatment immunostained against phospho-ribosomal protein S6 (p-rpS6, red) and DAPI (blue). In uninjured retina, a few p-rpS6-positive cells (red) are detected in the inner nuclear layer (INL). At 1 dpMNU, a massive increase of p-rpS6 occurs across the INL. At 2 and 3 dpMNU, a colocalization between p-rpS6 (red) and careg:EGFP (green) is observed. At 7 and 11 dpMNU, most of cells are single-positive for each of these markers. (C) Workflow with 0.1% DMSO and 1 μM Rapamycin treatment. (D) Retina sections at 2 and 7 dpMNU treated with DMSO or Rapamycin immunostained for p-rpS6 (green), PCNA (red), and DAPI (blue). In control samples, PCNA-positive cells are also p-rpS6-positive (arrowheads). Rapamycin treatment abrogates p-rpS6 expression and reduced the number of PCNA-positive cells. (E,F) Quantification of PCNA-positive and p-rpS6-positive cells. Histogram displays average values for each group. Each dot represents a biological replicate (N > 4). Error bars, SEM. P-value was determined by two-way ANOVA with Šidák multiple comparisons test. *P = 0.034; **P = 0.0017; ***P < 0.001. |
|
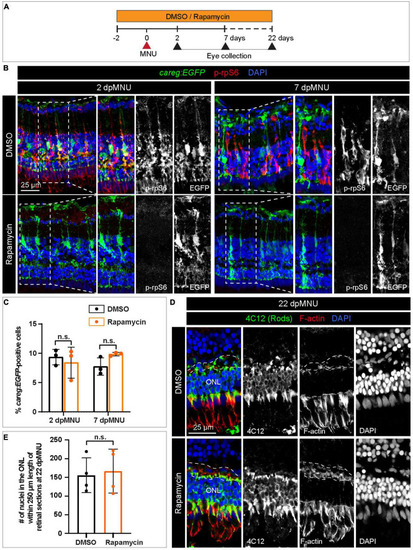
The careg element is not regulated by TOR signaling in regenerating retina. (A) Experimental design with 0.1% DMSO and 1 μM Rapamycin treatment. (B) Transversal sections of regenerating careg:EGFP (green) retinas at 2 and 7 dpMNU treated with DMSO or Rapamycin immunostained for the phosphorylated ribosomal protein p-rpS6 (red). Rapamycin treatment suppresses p-rpS6 immunoreactivity without affecting careg:EGFP expression (green). (C) Quantification of careg:EGFP-positive cells show a non-significant change between DMSO and Rapamycin-treated samples. Error bars, SEM. P-value was determined by two-way ANOVA with Sidák multiple comparisons test. n.s., not significant; N = 3. (D) Immunostaining of retina at 22 dpMNU demonstrates restoration of 4C12-positive rods (green) and F-actin-positive synaptic processes of the outer plexiform layer (encompassed with a dashed line). The position of outer nuclear layer (ONL) is indicated. (E) Quantification of nuclei in the outer nuclear layer within 250 μm length of retinal sections at 22 dpMNU. Error bars, SEM. P-value was determined by unpaired two-tailed Student’s t-test. n.s., not significant; N = 4. |
|
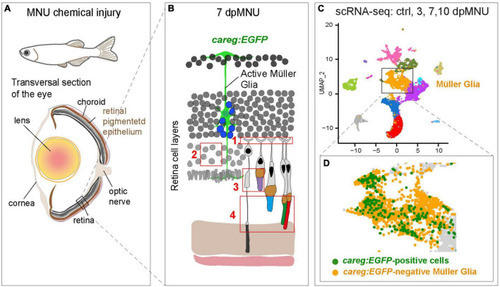
Identification of molecular differences between careg:EGFP-positive versus careg:EGFP-negative Müller glia during retina regeneration. (A) Schematic illustration of the experimental model in this study. (B) Cartoon of the retina at 7 dpMNU displays the induction of careg:EGFP expression in activated Müller glia (green cell), which give rise to the formation of proliferative progenitor cells (blue nuclei). The phenotypic defects of MNU-injury are highlighted in red frames: (1) Abolishment of actin filaments in synaptic photoreceptor processes in the outer plexiform layer. (2) Decrease of rod cell bodies in the outer nuclear layer. (3) Damage of inner segments of rod photoreceptors and the outer segments of UV-cones. (4) Distortion of photoreceptor outer segments. (C) UMAP visualization of cell clusters from the RNA-sequencing data of careg:EGFP retinas. (D) careg:EGFP-positive cells are detected mostly in the cluster of Müller glia. |

