FIGURE SUMMARY
Title

AMFR dysfunction causes autosomal recessive spastic paraplegia in human that is amenable to statin treatment in a preclinical model

Authors
Deng, R., Medico-Salsench, E., Nikoncuk, A., Ramakrishnan, R., Lanko, K., Kühn, N.A., van der Linde, H.C., Lor-Zade, S., Albuainain, F., Shi, Y., Yousefi, S., Capo, I., van den Herik, E.M., van Slegtenhorst, M., van Minkelen, R., Geeven, G., Mulder, M.T., Ruijter, G.J.G., Lütjohann, D., Jacobs, E.H., Houlden, H., Pagnamenta, A.T., Metcalfe, K., Jackson, A., Banka, S., De Simone, L., Schwaede, A., Kuntz, N., Palculict, T.B., Abbas, S., Umair, M., AlMuhaizea, M., Colak, D., AlQudairy, H., Alsagob, M., Pereira, C., Trunzo, R., Karageorgou, V., Bertoli-Avella, A.M., Bauer, P., Bouman, A., Hoefsloot, L.H., van Ham, T.J., Issa, M., Zaki, M.S., Gleeson, J.G., Willemsen, R., Kaya, N., Arold, S.T., Maroofian, R., Sanderson, L.E., Barakat, T.S.
Source
Full text @ Acta Neuropathol.

Homozygous AMFR loss-of-function variants in 20 individuals affected by HSP. a Clinical photographs of affected individuals at various ages. No major dysmorphic features are observed. b Family pedigrees of ascertained individuals, with familial AMFR variant and ethnic origin of families indicated. HSP-affected individuals with bi-allelic AMFR variants are indicated with black-filled symbols and numbered. Unaffected, heterozygous individuals are marked with a black dot. Unaffected individuals with wild-type alleles are represented by the non-filled symbols, whereas unaffected individuals of which no DNA was available for genotyping are marked with a question mark. Consanguineous parents are indicated with a double connection line. Males are squares; females are circles. c Genetic investigations in Family 1. Left panel shows aligned WGS reads from individual 1 and individual 2 in the IGV genome browser (left to right is from the centromeric to telomeric direction on chromosome 16q12.2), identifying a homozygous chr16(GRCh37):g56459228del in the first exon of AMFR. Right panel shows Sanger sequencing chromatograms (in the same orientation as the IGV genome browser view) from both affected homozygous individuals 1 and 2, both unaffected parents that are heterozygous for the deletion, and the unaffected, third oldest brother that is homozygous for the wild-type allele. Full segregation of the single-nucleotide deletion with the HSP phenotype in the Family 1 is shown in Supplementary Fig. 2. d Immunohistochemistry detecting AMFR in human fetuses at gestational week (GW) 6 and GW9. To characterize AMFR expression in various human tissues, we performed immunohistochemistry of human fetuses during the first trimester of pregnancy, using a C-terminal epitope recognizing antibody. AMFR staining of hepatocytes was noticed in all fetuses at GW6 and GW9. Central nervous system staining includes pale labeling of neuropil in the proliferative neuroepithelium of the hypothalamic, cortical, mesencephalic, and thalamic region (I, II, III and IV), as well as the marginal zone of the spinal cord (V) and cuboidal cells of choroid plexus (VI). e Structural protein model for the main AMFR isoform and the truncated isoform uc002eix.3, including the various variants identified in this study. Signal peptide is kept intact in the model to show the frameshift mutation, p.Phe5Serfs*45. The relative positions of AMFR domains are modified for clarity from the model predicted by AlphaFold2 (accession number AF-Q9UKV5-F1) [44]. Domains are color-coded. Other regions, including loops and unassigned structural elements, are shown in gray. Residues linked to patient variants are shown as pink sphere models. The region encoded by exon 9 and exon 10 is indicated by a transparent surface. The membrane and its cytosolic and luminal sides are outlined by dashed lines. Phobius (https://phobius.sbc.su.se) predictions were used to support the membrane location of AMFR regions. The main AMFR isoform contains an N-terminal signal sequence (residues 1–37), a multipass transmembrane domain (TMD) (residues 82–302), a cytosolic C-terminus which carries a Really Interesting New Gene (RING)-type zinc finger (residues 327–382), a coupling of ubiquitin conjugation to the ER degradation (CUE) domain (residues 457–497), a UBE2G2-binding region (G2BR) (residues 574–600), and a Valosin-containing protein (VCP)-interacting motif (VIM) (residues 622–640). These domains are connected by disordered regions, with residues 504–579 being compositionally biased toward polar and charged residues [43]. AMFR has an unusually open arrangement of the TMD helices, suggesting that they may form homo- or heterocomplexes. Nonetheless, the TMD appears dispensable for AMFR ligase activity [20]. The RING and G2BR domains interact with the E2 ubiquitin-conjugating enzyme UBE2G2, and the CUE domain recognizes ubiquitins on substrates. Association between the G2BR domain with UBE2G2 causes conformational alterations in UBE2G2, increasing affinity of UBE2G2 for AMFR. The VIM interacts with the AAA ATPase and segregase VCP/p97 [43]. Finally, the RING domain is tethered to the last TMD helix. Transcript uc002eix.3 (not annotated in NCBI) encodes a truncated form of AMFR (277 amino acids, 33 kDa), starting at an out of frame ATG in main transcript exon 7. This isoform lacks the TMD and RING domains N-terminal to the CUE domain, and therefore does not harbor E3 ligase activity. It has acquired 60 N-terminal residues without significant sequence identity to regions of known function for which AlphaFold2 predicts, with low confidence, the presence of a beta-sheet. f Western blotting analysis detecting AMFR and Vinculin in patient-derived fibroblasts from Family 1 and Family 8 and controls, showing the absence of the main AMFR protein isoform in patient cells. Full-length uncropped Western blot is given in Supplementary Fig. 4c

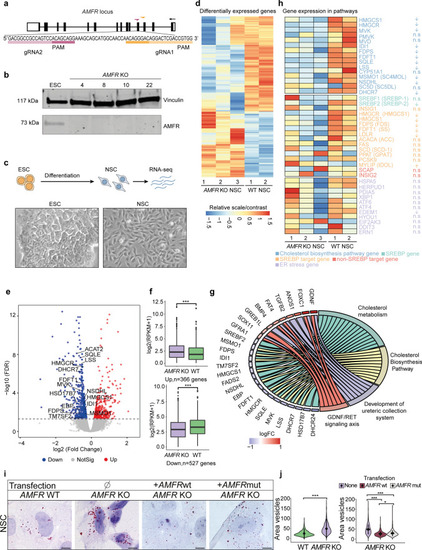
AMFR knockout neural stem cells show defects in cholesterol metabolism. a Schematic representation of the AMFR gene at chromosome 16q12.2. Filled boxes represent exons. Zoom-in shows the target sequence and gRNAs used to generate the AMFR KO ESCs. b Western blotting detecting AMFR (117 kDA) in wild-type H9 ESCs and AMFR KO ESC clones 4, 8, 10, and 22. Vinculin is used as a housekeeping control. Uncropped full-length Western blot is shown in Supplementary Fig. 5c. c Scheme showing the experimental outline and representative bright-field images of ESCs and differentiated NSCs. d Scaled heatmap depicting the RPKM gene expression from RNA-seq analysis of the 366 upregulated and 566 downregulated differentially expressed genes (FDR < 0.05) between wild type and AMFR KO NSCs. e Volcano plot showing log2 fold change and -log10(FDR) of the 366 upregulated and 566 downregulated differentially expressed genes between wild type and AMFR KO NSCs. Labels indicate selected genes. f Box plots showing the RNA-seq gene expression levels (log2(RPKM + 1) for the 366 upregulated and 566 downregulated genes in wild type and AMFR KO NSCs. Boxes represent the interquartile range (IQR); lines represent the median; whiskers extend to 1.5 × the IQR; dots represent outliers. (Wilcoxon test, *** p < 0.001). g GOChord plot of enrichment analysis, with the top-2 upregulated and downregulated terms from Wiki pathways, respectively. The left side of the GOChord diagram represents logFC, and the right side represents different terms of enrichment. The connecting bands indicate the corresponding pathways for each gene. h Scaled heatmap showing the RPKM gene expression levels for selected cholesterol biosynthesis pathway genes (blue), SREBP-1 and SREBP-2 (green), SREBP target genes (orange), non-SREBP target genes involved in cholesterol metabolism (red), and genes involved in ER stress response (purple). i Representative images of ORO staining detecting lipid droplets in wild type and AMFR KO NSCs, and in AMFR KO NSCs transfected with plasmids expressing wild-type AMFR or a RING mutant AMFR. Scale bars = 10 µm. j Quantification of the lipid droplet size from ORO staining from i). Violin plots showing the area of the quantified droplets in pixels and the distribution of the data. Data in the right plot are obtained from 2 wild-type NSCs (green colored) and 3 AMFR KO NSCs (purple colored) (biological replicates), cultured and stained each in two technical replicates, assessing n ≥ 400 droplets for each sample. Data in the left plot show the same quantification of the rescue experiments, where KO NSCs were transfected with a plasmid expressing wild type AMFR (brown) or a RING mutant AMFR (gray). Black circles, median; black line, SD (Kruskal–Wallis test for WT vs KO NSCs, Dunn’s Multiple Comparison test for the rescue experiment, *p < 0.05; ***p < 0.001)

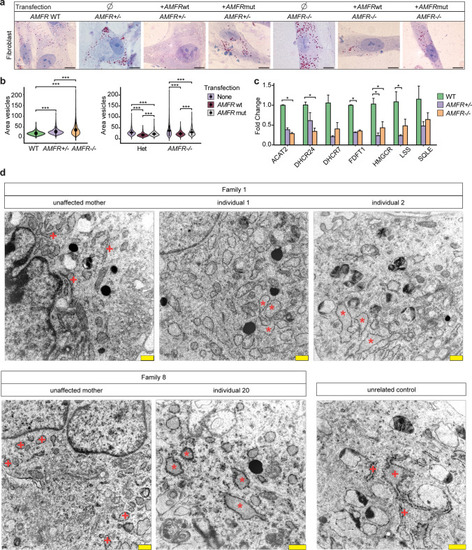
Patient-derived fibroblasts with AMFR loss-of-function variants show disturbed lipid metabolism and altered endoplasmic reticulum morphology a Representative images of ORO staining identifying lipids in unrelated wild type, heterozygous carrier (unaffected mothers from Family 1 and 8) and homozygous AMFR patient-derived fibroblasts from individuals 1, 2, and 20, and in the same fibroblasts transfected with plasmids expressing wild-type AMFR or RING mutant AMFR. Scale bars = 10 µm. b Left violin plots showing the size area of the quantified lipid droplets in pixels from ORO stained fibroblasts from a). Data from 2 wild-type fibroblasts (green colored), 2 heterozygous carrier AMFR fibroblasts (unaffected mothers of Family 1 and 8, purple colored) and 3 homozygous AMFR patient-derived fibroblasts (from individuals 1, 2, and 20, orange colored) (biological replicates), cultured and stained each in two technical replicates, assessing n ≥ 400 droplets for each sample. Black circle, median; black line, SD (Dunn’s Multiple Comparison test, ***p < 0.001). Right violin plot shows the same quantification from a), but then for heterozygous or homozygous AMFR fibroblasts transfected with plasmids expressing wild type AMFR or RING mutant AMFR, as indicated. c qRT-PCR expression analysis of genes involved in cholesterol metabolism in wild type (n = 2), heterozygous (n = 2, from unaffected mothers of Family 1 and 8), and homozygous (n = 3, from individuals 1, 2, and 20) AMFR patient-derived fibroblasts. Bar plot showing the mean fold change for the indicated genes compared to wild type, normalized for the housekeeping gene TBP. Each fibroblast line was cultured in two independent duplicates, and measured using two technical replicates and two independent experiments. Error bars represent SEM (Dunn’s Multiple Comparison test, *p < 0.05; **p < 0.01; ***p < 0.001). d Electron microscopy of cultured fibroblasts from individuals 1, 2, and 20, harboring homozygous truncating AMFR variants, as well as their respective heterozygous carrier mothers and an unrelated control. Affected individuals show an abundance of large vesicles indicative of lipid droplets as well as large, dilated rough endoplasmic reticulum (RER, red asterisks) as compared to the more compact RER seen in unaffected parents and an unrelated control (red + signs). Scale bars = 500 nm

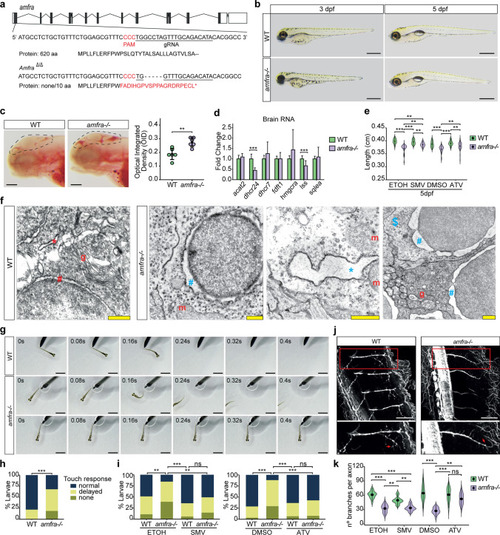
amfra-/- zebrafish larvae show alterations in lipid metabolism and endoplasmic reticulum morphology, abnormal touch-evoked escape response and motor neuron branching defects that can be rescued by statin treatment. a Schematic drawing of the amfra locus in zebrafish, the gRNA used and the generated mutation, causing a 5 bp frameshift in the first coding exon of amfra. Coding exons, black; non-coding exons, white. b Representative bright-field images of wild type and amfra-/- larvae at 3 dpf and 5 dpf. amfra-/- larvae appear morphologically similar to wild-type (WT) larvae at both developmental stages. Scale bars = 500 µm. c Representative images and quantification of ORO staining of 3 dpf larvae, dotted line indicating the region of interest (ROI) used for quantifications. Circles show individual values for each larva, n = 6 larvae per genotype (WT, green; amfra-/-, purple). Error bars represent SD (Kruskal–Wallis test, **p < 0.01). Scale bars = 100 µm. d qRT-PCR expression analysis for selected cholesterol metabolism genes, in brains of 5 dpf control and amfra-/- larvae (n = 10 brains per sample, 4 biological replicates for WT larvae and 5 biological replicates for amfra-/-, from 2 independent experiments, with each biological replicate measured in two technical replicates). Bar plot showing the mean fold change for the indicated genes compared to control larvae, normalized for the housekeeping gene eef1a1. WT, green. amfra-/-, purple. Error bars represent SD (Kruskal–Wallis test, ***p < 0.001). e Violin plot showing the length of wild type (WT) and amfra-/- larvae at 5 dpf. Larvae are either treated starting from 8 hpf onwards with simvastatin (SMV) or atorvastatin (ATV), or with their respective vehicle controls ethanol or DMSO. Whereas statin treatment does not influence the length of WT larvae, it significantly increases the length of amfra-/- larvae, partially rescuing the observed length deficit of amfra-/- larvae compared to WT. n > 20 per genotype and treatment group (Dunn’s Multiple Comparison test, **p < 0.01; ***p < 0.001). f Electron microscopy of brains from WT and amfra-/- larvae at 5 dpf. amfra-/- larvae show dilated rough endoplasmic reticulum decorated with ribosomes (blue *) and an expanded perinuclear space (blue #) as compared to controls (red * and #, respectively). Many cells in the amfra-/- samples have less densely stained cytoplasm (example indicated with a blue $). m = mitochondrion (normal appearing) and g = Golgi apparatus (normal appearing). Scale bars = 500 nm. g Representative bright-field images for the touch-evoked escape response (upper row: normal response; middle row: delayed response; bottom row: no response) of 3 dpf WT and amfra-/- larvae. Scale bars = 500 µm. h Quantification of the touch-evoked escape response in WT and amfra-/- larvae at 3 dpf, n > 45 per genotype, from 3 experimental replicates (Chi-square test, ***p < 0.001). i As H, but now for WT and amfra-/- larvae treated with simvastatin (SMV) or atorvastatin (ATV) and their respective vehicle controls, ETOH and DMSO (Chi-square test, **p < 0.01; ***p < 0.001; ns = not significant). j Immunostaining for acetylated tubulin in WT and amfra-/- embryos. Shown are max projections from z-stacks of 2 dpf embryos, acquired from lateral view of the middle of the trunk. The region indicated by the red rectangle is shown in enlargement in the insert below. amfra-/- embryos show reduced axon branching in ventral motor neurons in comparison to control (red arrow indicates a branching). Scale bars = 50 µm. k Violin plot showing the quantification of axon branching of ventral motor neurons in WT (green) and amfra-/- embryos (purple), treated with vehicle (ETOH or DMSO) or statin (SMV or ATV); n = 6 embryos per group; for each embryo, two axons were quantified. Black circle, median; black line, SD (Dunn’s Multiple Comparison test, **p < 0.01; ***p < 0.001; ns = not significant)

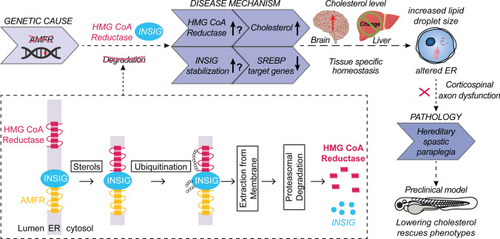
Hypothetical model describing the processes leading to HSP upon AMFR dysfunction. Upon loss of function of AMFR, degradation of HMGCR and INSIG proteins is likely blunted, resulting in an increased cholesterol synthesis rate upon HMGCR stabilization and a compensatory repression of SREBP processing causing reduced expression of lipogenic SREBP target genes upon stabilizing of INSIG proteins. The net effect of these opposing lipogenic and non-lipogenic processes is a disturbance in the balance of lipid and cholesterol homeostasis which is reflected by increased lipid droplet size in patient-derived fibroblasts and in human neural stem cells in the absence of AMFR. Possibly, cell-type-specific and species-specific differences in the balance between both opposite processes might occur, explaining the absence of increased cholesterol levels in patient serum and contradictory results in Amfr knockout mice. The increased lipid droplet size and concomitant alterations in the morphology of the endoplasmic reticulum then lead to neurotoxicity, causing dysfunction of the corticospinal tract due to an yet to be explored pathomechanism. Upon cholesterol lowering therapy in amfra-/- zebrafish larvae, this neurotoxicity is prevented, causing rescue of the observed phenotypes

ZFIN is incorporating published figure images and captions as part of an ongoing project. Figures from some publications have not yet been curated, or are not available for display because of copyright restrictions.

PHENOTYPE:
Fish:
Observed In:
Stage: Day 5

ZFIN is incorporating published figure images and captions as part of an ongoing project. Figures from some publications have not yet been curated, or are not available for display because of copyright restrictions.

Acknowledgments
This image is the copyrighted work of the attributed author or publisher, and ZFIN has permission only to display this image to its users. Additional permissions should be obtained from the applicable author or publisher of the image. Full text @ Acta Neuropathol.