- Title
-
Nucleolar Protein 56 Deficiency in Zebrafish Leads to Developmental Abnormalities and Anemia via p53 and JAK2-STAT3 Signaling
- Authors
- Liang, F., Lu, X., Wu, B., Yang, Y., Qin, W.
- Source
- Full text @ Biology (Basel)
|
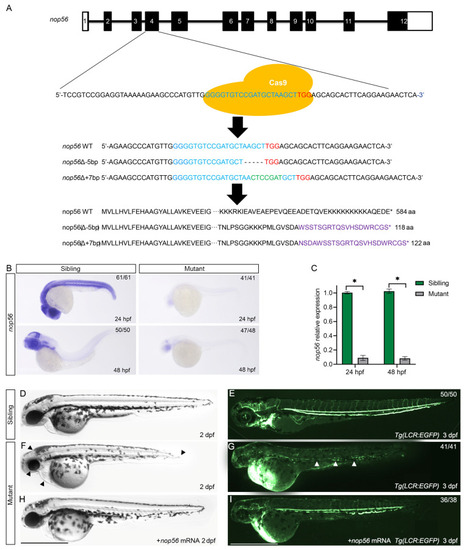
Generation of a nop56 mutation using the CRISPR/Cas9 system. (A) Schematic describing the target site of nop56. The genomic sequences and predicted protein sequences based on the DNA sequence in the wildtype and nop56−/− mutants are shown. (B) WISH of nop56 in the siblings and mutants at 24 and 48 hpf. The results were verified independently three times. (C) The qRT-PCR of nop56 transcript levels in the wildtype siblings and nop56−/− mutants at 24 and 48 hpf. The qRT-PCR was performed with biological repeats and technical repeats in triplicate (n = 3, * p < 0.05). (D–H) In vitro-transcribed nop56 mRNA (400 pg) partially rescued the phenotype in nop56 mutants. A smaller head, edema in the heart, and a shorted tail extension (arrowhead) were present. (E–I) Analysis of blood cells in the Tg(LCR:EGFP) transgenic line. The arrowhead indicates red blood cells. All scale bars represent 1 mm. |
|
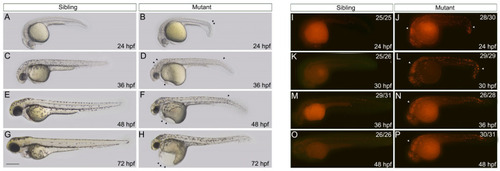
The embryos with nop56 deficiency display morphological abnormalities due to increased apoptosis. (A–H) The phenotypes of wildtype siblings and nop56−/− mutants. At 24 hpf (A,B), a minor curved tail (arrowhead) and slightly slower development were seen in the mutants. At 36 hpf (C,D), the ventricle and cerebellum of the mutants showed obvious bulging, and malabsorption of the yolk led to a slight swelling of the yolk sac, and pigmentation was delayed. The narrow eyes and edema in the heart were more apparent at 48 hpf (E,F). At 72 hpf (G,H), the mutants showed cardiac edema, a severely deformed trunk and yolk, and a smaller head and eyes. (I–P) The apoptosis level of the siblings and mutants at 24 hpf (I,J), 30 hpf (K,L), 36 hpf (M,N), and 48 hpf (O,P), determined using TUNEL staining. The arrowhead indicates apoptotic signals. All scale bars represent 500 μm. |
|
Nop56 deficiency impairs erythroid maturation. (A) o-Dianisidine staining showed depletion of erythroid cells in nop56−/− embryos compared to wildtype siblings at 48 hpf. (B) Wright–Giemsa staining of erythroid cells at 2.5 dpf in siblings and mutants. (C) WISH showed that the expression patterns of scl and lmo2 were indistinguishable between siblings and mutants before 24 hpf. (D) WISH showed no difference in gata1 expression in nop56−/− embryos at 20 hpf between siblings and mutants, but a minor reduction occurred at 24 hpf in mutants. (E) WISH revealed that c-myb expression was significantly reduced from 36 hpf. (F) Expression of hbae1.1 was gradually decreased from 32 to 36 hpf (n = 3). (G) WISH showed that the number of myeloid cells marked with lyz and lcp1 was slightly decreased at 32 hpf. (H) Analysis of vasculature after crossing nop56 mutants with the Tg(kdrl:GRCFP)zn1 transgenic fish line. The vasculature development was normal in mutants. All scale bars represent 500 μm. |
|
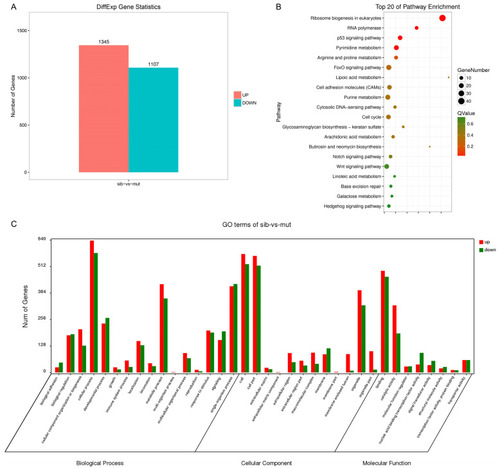
Transcriptome analysis of nop56 mutants. (A) Differential expression analysis of genes between siblings and mutant groups. (B) Pathway enrichment analysis identified the top 20 pathways affected in mutants. (C) Gene Ontology analysis between siblings and mutants. |
|
Knockdown of p53 and inhibition of jak2 partially rescue malformation and anemia in nop56 mutants. (A) WISH analysis of p53 in siblings and mutants. (B) qRT-PCR showed that p53 expression was increased significantly in nop56 mutants. qRT-PCR was performed with biological repeats and technical repeats in triplicate. n = 3, * p < 0.05. (C) Analyses of the phenotype and hemoglobin level after p53 knockdown and CEP-33779 treatment in nop56 mutants. Knockdown of p53 partially rescued the morphological malformations, but not anemia, at 48 hpf. However, CEP-33779 partially rescued the anemic phenotype, but not malformations, at 48 hpf. Arrowhead indicates erythroid cells. All scale bars represent 1 mm. |


