
- Title
-
Combined effects of microplastics and benz[a]anthracene on cardiotoxicity in zebrafish (Danio rerio) larvae: Size matters
- Authors
- Sim, Y., Cho, H.J., Lee, J.S., Lee, W.S., Kim, H., Jeong, J.
- Source
- Full text @ Chemosphere
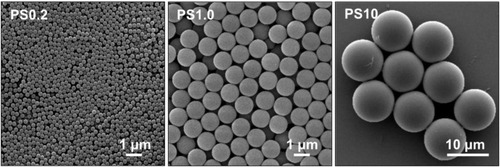
Fig. 1. The morphology of PSMPs (0.2, 1.0, and 10 μm) by SEM. |

Fig. 2. Cardiac defects of wild-type (AB strain) zebrafish larvae at 96 hpf exposed to PSMPs with 1, 5, and 10 ppm BaA for 72 hpi. (a) Representative images of cardiac malformation. Pericardial edema (PE) and string heart (SH) are indicated by a solid black arrow. (b) Cardiac defect of larvae at 96 hpf. The statistical difference compared to the control group: *p < 0.05, **p < 0.01, and ***p < 0.001. The statistical difference compared to the BaA treatment group: #p < 0.05, ##p < 0.01, and ###p < 0.001. Scale bar: 500 μm. |

Fig. 3. Vascular development of Tg (kdrl;mCherry) line zebrafish larvae at 96 hpf exposed to PSMPs in the presence of 5 and 10 ppm BaA for 72 hpi. (a) The fluorescence images of zebrafish larvae in the head and heart region, (b) The vessel formation of zebrafish larvae analyzed by fluorescent intensity using Image J software. The statistical difference compared to the control group: *p < 0.05 and **p < 0.01. The statistical difference compared to the BaA treatment group: #p < 0.05. Scale bar: 500 μm. |

Fig. 4. CYP1A, ROS, and cell death in the wild-type (AB strain) zebrafish larvae exposed to PSMPs in the presence of 5 and 10 ppm BaA. (a) The EROD induction by the live-imaging assay in larvae. (b) The EROD activity. (c) The fluorescence images of larvae stained by H2DCFDA. The white arrow pointed to the heart region. (d) ROS generation in the heart region of the larvae. (e) The fluorescence images of larvae stained by AO. (f) Cell death the in the heart region of the larvae. The white rectangular boxes indicated the heart region for analysis of cell death. The statistical difference compared to the control group: *p < 0.05 and ***p < 0.001. The statistical difference compared to the BaA treatment group: #p < 0.05, ##p < 0.01, and ###p < 0.001. Scale bar: 500 μm. |

Fig. 5. Body burden of BaA in the presence of PSMPs in zebrafish larvae at 96 hpf. (a) Body burden of BaA in the absence and presence of PSMPs in zebrafish larvae. (b) The amount of PS particles in zebrafish larvae at 96 hpf analyzed by fluorescence intensity. (c) Biodistribution of PSMPs in zebrafish larvae at 96 hpf exposed to green fluorescent PS particles for 72 hpi. The statistical difference compared to the control group: *p < 0.05, **p < 0.01, and ***p < 0.001. (For interpretation of the references to colour in this figure legend, the reader is referred to the Web version of this article.) |

Fig. 6. Overview of the process of cardiotoxicity induced by BaA in the presence of three sizes of PSMPs in zebrafish larvae. |