
- Title
-
Lifelong regeneration of cerebellar Purkinje cells after induced cell ablation in zebrafish
- Authors
- Pose-Méndez, S., Schramm, P., Winter, B., Meier, J.C., Ampatzis, K., Köster, R.W.
- Source
- Full text @ Elife

(A) Construct used to generate the Tg(PC-ATTAC) transgenic line, modified from Weber et al., 2016. (B) Images of the PC layer (fyn-tagRFP-T fluorescence expressed in mature PCs) after induced PC ablation in larvae at 4–6 dpf monitoring 10 days after 4-hydroxy-tamoxifen (4-OHT) treatment. (C) Number and percentage of PCs in ablated (4-OHT) vs control (EtOH) larvae. (D–G) Quantitative monitoring of PC regeneration after induced PC ablation in larvae. (D–F) Numbers and percentage of PCs until 6 mpt. (G) Images of PCs on sagittal cerebellar sections after immunostaining with anti-tagRFP and anti-ZebrinII antibodies, comparing ablated and control groups at 1 and 6 mpt. Statistical information: sample size n=4-9, statistical method=unpaired t-test two tailed, levels of significance=P <0.0001 (****), P=0.0001 (***). Additional information in Supplementary file 1.
|
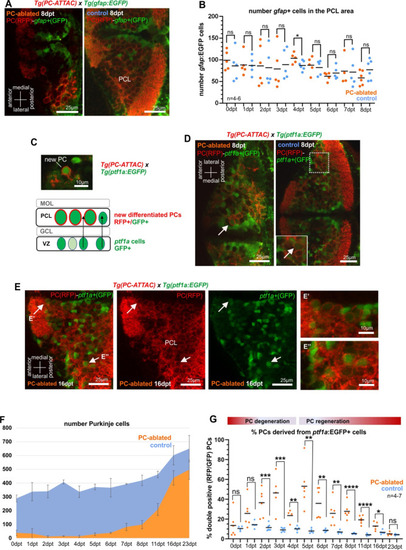
(A) Images of larval cerebellum of the double transgenic line Tg(PC-ATTAC)/Tg(gfap:EGFP) after induced PC ablation. (B) Number of gfap+ cells throughout the PC layer area during PC degeneration and beginning of regeneration. (C) Illustration of new PC development from ptf1a+ progenitors. (D, E) Images of larval cerebellum of the double transgenic line Tg(PC-ATTAC)/Tg(ptf1a:EGFP) after induced PC ablation, revealing double-positive cells (arrows). Average of PC numbers (F) and percentage of PCs showing GFP fluorescence double-positive cells, (G) during degeneration and regeneration of PCs. The red fluorescent protein from the PC-ATTAC strain is exclusively expressed in the cell membrane, while EGFP from the ptf1a- and gfap-reporter strains localizes to the cytoplasm. GFP and RFP were enhanced by fluorescence immunohistochemistry in A, C–E. Statistical information: statistical method=unpaired t-test two tailed, levels of significance=P<0.05 (*), P<0.01 (**), P<0.001 (***), P<0.0001 (****). Additional information in Supplementary file 1.
|
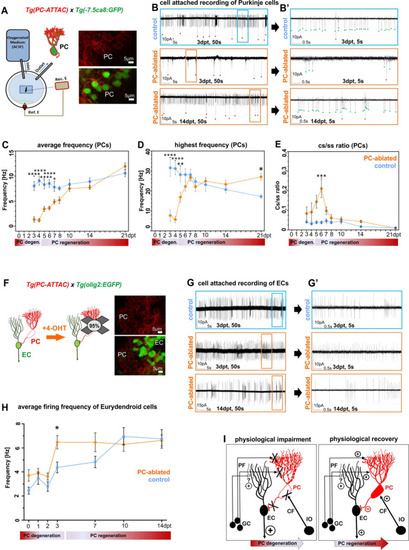
(A) Patch-clamp recording setup used for all experiments. Fluorescent PCs in larvae of the double transgenic line Tg(PC-ATTAC)/Tg(–7.5ca8:EGFP). (B) 50 s trace of representative recordings of the tonic firing activity in control larvae 3 days after EtOH or in PC-ablated larvae 3 and 14 days after 4-hydroxy-tamoxifen (4-OHT) treatment and (B’) 5 s traces for all three traces shown. Red dots mark complex spikes and green dots mark simple spikes. (C–E) Diagrams representing results of the electrophysiologic investigations in PCs. (C) Average tonic firing frequency plotted vs dpt. (D) Highest spontaneous bursting frequency over an interval of 1 s during a 100 s trace plotted vs dpt. (E) Ratio of the complex spikes to simple spikes vs dpt. (F) Illustration of PC loss after 4-OHT treatment and representative image of the PC layer from a double transgenic Tg(PC-ATTAC)/Tg(olig2:EGFP) larva. (G) 50 s trace of representative recordings of the tonic firing activity of ECs in control larvae 3 days after EtOH or in PC-ablated larvae 3 and 14 days after 4-OHT treatment and (F) 5 s traces for all 3 traces shown. (H) Average tonic firing frequency of ECs after PC ablation plotted vs dpt. (I) Illustration of physiological impairment and recovery model of the input/output of PCs during PC degeneration and regeneration, respectively. Statistical information: sample size n=17-45, statistical method=2-Way ANOVA, Šídák's multiple comparisons test, levels of significance=P<0.05 (*), P<0.01 (**), P<0.001 (***), P<0.0001 (****). Additional information in Supplementary file 1.
|

Illustration of OKR setup (A) and eye movements in larvae (B) during performance of the OKR test. (C) Representative graphs showing OKR response performance during acute PC degeneration (2 dpt) and regeneration (10 dpt) phases in PC-ablated (4-hydroxy-tamoxifen [4-OHT] treated) vs control group (EtOH treated). (D) Quantification of OKR response: number of normal saccades (eye rotation >19.5°) and speed of eye rotation during slow phase movements at 2 and 10 dpt. The data correspond to the results of two independent trials that were pooled. Statistical information: statistical method=Mann-Whitney test or unpaired t-test, two tailed, level of significance=P<0.0001 (****). Additional information in Supplementary file 1.
|

(A) Heat map representing the location of zebrafish larvae in a 12-well plate during 6 min of swimming. (B) Example of swim track after PC ablation (2 dpt) and during regeneration (10 dpt) phases. (C) Quantitative analysis of swim preferences along the edge vs center zone of the arena (frequency of visits and percentage of time spent in the center zone) in PC-ablated larvae vs control groups. (D) Quantitative analysis of locomotor activity (total distance traveled, mean and maximum swimming speed) in PC-ablated larvae vs controls. (E) Graphs showing distance traveled and swim speed every 2 s during the tracking period, comparing PC-ablated vs control larvae. (F) Illustration summarizing impairment and recovery of optokinetic response (OKR) (Figure 4) and locomotor behavior during PC degeneration and early regeneration phases, respectively.The data from free swim tests correspond to the results from four independent ablations that were pooled. Statistical information: size sample n=78-135, statistical method=ANOVA Kruskal-Wallis, Dunn´s multiple comparisons test, levels of significance=P<0.05 (*), P<0.01 (**), P<0.001 (***), P<0.0001 (****). Additional information in Supplementary file 1.
|

(A) In vivo stereomicroscopy showing tagRFP-T fluorescence in the PC layer, and illustration of the time course of fluorescence recovery after PC ablation in adults (at 5 mpf) monitored until 1 ypt. Representative confocal images of whole mount cerebelli from dorsal view (B–E) and sagittal vibratome sections after immunostaining with the antibodies anti-tagRFP and anti-ZebrinII (F–K), comparing the cerebellum in ablated fish (endoxifen treated; C–E, F–H) vs control group (dimethyl sulfoxide [DMSO] treated; B, I–K). Arrows in C, F point out apoptotic bodies. Equivalent results were observed in two additional independent ablations in adult cerebelli (data not shown).
|
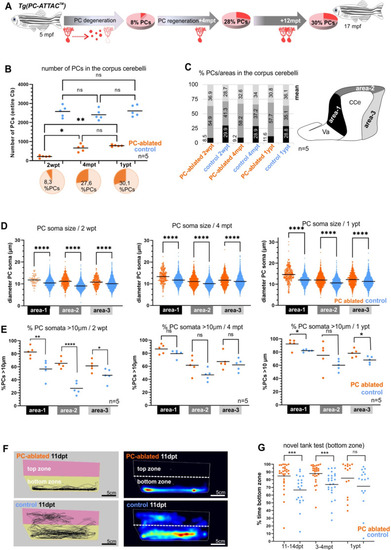
(A) Illustration of the percentage of PC layer replenishment during degeneration and regeneration phases. (B) Number and percentage of PCs after induced PC ablation monitored until 1 ypt. (C) Subdivision of the corpus cerebelli (CCe) into rostral, dorsal and caudal areas (areas 1–3), and the respective proportion of PCs in each area. (D) Quantification of the diameter of PC somata in the different areas of the CCe. (E) Percentage of PCs with somata larger than 10 µm from the total amount of PCs per area per brain. (F) Representative images of swim tracks and heat map of location of adult zebrafish in the novel tank test during 6 min. (G) Percentage of time spent in the bottom zone. The data correspond to the results from three independent PC ablations that were pooled. The cellular quantification in all graphs represent PCs from the entire CCe of 5 fishes per group per time point, as average from the whole PC population of each brain (B, C, E), or at single-cell level that were pooled (D). Statistical information: statistical method=analysis of variance (ANOVA) test for multiple groups comparison (ordinary one-way ANOVA- followed by Sidàks multiple comparison test), or Student’s t-test for two groups comparison (unpaired t-test two tailed for parametric, or Mann-–Whitney two tailed for no parametric data), levels of significance=P<0.05 (*), P<0.01 (**), P<0.001 (***), P<0.0001 (****). Additional information in Supplementary file 1.
|