- Title
-
A Visual Interface for Exploring Hypotheses about Neural Circuits
- Authors
- Vohra, S.K., Harth, P., Isoe, Y., Bahl, A., Fotowat, H., Engert, F., Hege, H.C., Baum, D.
- Source
- Full text @ IEEE Trans. Vis. Comput. Graph.
|
A: Graphical illustration of a circuit hypothesis concerning inhibiting escape behavior in larval zebrafish, described in detail in case study 1 (Section VI-C). B: Layers of the optic tectum used in hypothesis 2 of case study 1 (Section VI-C). C: Generation of a query for searching groups of neurons, using the query builder (Section V-A1). D: Listing of possible pathways using the pathway browser (Section V-B1). E: 3D viewer showing the morphology of neurons matching the filter criteria (Section V-C2). F: Visualization of a neuron circuit using the circuit viewer (Section V-C1). |
|
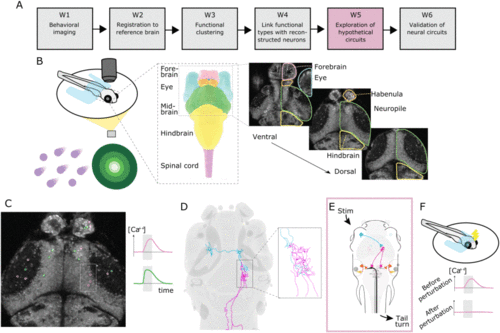
Overall workflow for uncovering neural circuits – exemplified by circuits controlling movement behavior of larval zebrafish following visual stimuli. For a complete description of the steps, see Section III; note that for step W2 there is no subfigure here. A: All major working steps. B: First, a behavior imaging experiment is performed: (left) simplified view of the experimental setup and two types of stimuli: coherent dot motion stimuli (left purple) and looming stimuli (right, green); (mid) schematic drawing of relevant brain regions; (right) the activity of neural cells is recorded with Ca 2+ imaging in multiple z planes. C: The bodies of active neurons are segmented and functionally characterized based on their activity curves. D: From a large set of reconstructed neurons, those spatially closest to the active cells are determined – assuming that with some probability that they belong to the same functional type. E: Based on all the available information and pre-existing hypotheses about neural circuits, data-compatible circuits are constructed and explored. F: For the most likely hypothetical circuit, validation steps are performed, such as experimental perturbation. |
|
Design prototype and proposed solution. A: Initial visual interface for specifying query expressions. B: First prototype for displaying the constructed neural circuit as abstract 2D graph. C: Anatomical units and their abstract representation. D: New query builder (Section V-A1) for interactive query building. E: Circuit viewer (Section V-C1) for intuitive visualization of neural circuits. |
|
Exploration of hypothetical circuits (corresponding to working step W5 in the overall workflow, Fig. 2(a)): A: Functionally interesting brain regions are identified using the region finder (cf. Section V-A2). B left: A hypothetical circuit is generated using the query builder (cf. Section V-A1) and (B mid and right) visualized using the circuit viewer (cf. Section V-C1). C: All neurons contained in the circuit are then passed to the neuron browser (cf. Section V-B2). D: Selected neurons and anatomical context are visualized in the anatomical viewer (cf. Section V-C2). |
|
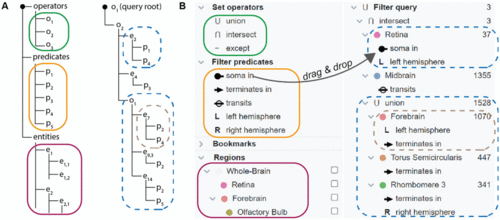
Query builder. A: Set operators, filter predicates, and biological entities (left tree) are used to construct a filter query (right tree). B: In our application, filter predicates describe spatial attributes of neurons in relation to regions. The user builds a query by dragging operators, spatial predicates and regions into the query tree. |
|
Visual components (Section V). A: Query builder (Section V-A1), showing the example query; the selected sub-queries are highlighted by green and orange bounding boxes, respectively. B: Pathway browser (Section V-B1), displaying the list of possible connections realizing the example query. C: Circuit viewer (Section V-C1), showing the realized neural circuits and regions corresponding to selected sub-queries enclosed by an envelope. The thickness of the blue connections encodes to number of neurons. D: Query builder (Section V-A1), showing the collapsed sub-queries. E: Pathway browser (Section V-B1), displaying the list of partially aggregated pathways. F: Circuit viewer (Section V-C1), showing the pathways as partially aggregated edges. G: Circuit viewer (Section V-C1), depicting two different selection modes for partially aggregated pathways. In the default mode, the links to all regions in the corresponding set are shown, e.g., pathways in the right hemisphere. Alternatively, an aggregated representation of pathways, e.g., the red line leading to the orange region, is displayed as an aggregated edge. |
|
Elementary case study (Section VI-B). A: Circuit viewer (Section V-C1) showing the forebrain nodes in the left and right hemisphere. B: Circuit viewer (Section V-C1) showing the forebrain and midbrain nodes in the left and right hemisphere; pathway browser (Section V-B1) showing the list of possible connections between forebrain and midbrain. C: Circuit viewer (Section V-C1) displaying the forebrain, midbrain and hindbrain nodes in the left and right hemisphere; listing of possible and selected pathways using the pathway browser (Section V-B1) |
|
Case study 1. A: Graphical illustration of the circuit hypothesis regarding the inhibiting escape behavior, proposed by Yao et al. [50], described in more detail in case study 1 (Section VI-C). B: Query builder (Section V-A1); C: Circuit viewer (Section V-C1); D: 3D visualization of glycinergic interneuron clusters that are located next to the Mauthner cell region. E: Example of a query, described in Section VI-C. The number of neurons satisfying each subquery are displayed with a subquery returning no results (red box); F: 3D view revealing the connectivity of neurons that have their soma in the stratum periventriculare and pass through the caudal hypothalamus; G: 3D view revealing the connectivity of neurons transiting through glycinergic interneuron clusters and projecting to the Mauthner region. |
|
Survey responses of the participants (9 from data science/visualization, 7 from neuroscience) |


