
- Title
-
A network of Notch-dependent and -independent her genes controls neural stem and progenitor cells in the zebrafish thalamic proliferation zone
- Authors
- Sigloch, C., Spitz, D., Driever, W.
- Source
- Full text @ Development

Notch-dependent and -independent her gene expression. (A-R′) her6, her9, her4 (her4.1-4.5 cluster probe), her15 (her15.1 and her15.2 cluster probe), her8a and her8.2 expression (WISH). 48 hpf WT sibling controls (mib1+/+ or mib1+/ta52b) (A-F) and mib1ta52b mutants (A′-F′). (G-L′) Heat shock overexpression of NICD compared with heat-shocked WT siblings at 72 hpf. (M-R′) Notch inhibition by LY-411575 (64 to 72 hpf) in 72 hpf larvae and DMSO controls. Sagittal optical sections at midline (lateral views, single DIC image planes, anterior at left, dorsal at top). pth, prethalamus; rh, rhombencephalon; tec, tectum opticum; tel, telencephalon; th, thalamus. Scale bar: 100 µm. |
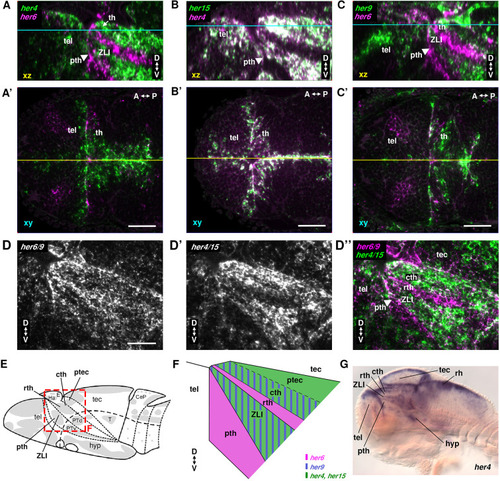
Co-expression analysis of her genes in the thalamic complex. (A-D″) Confocal imaging of double-fluorescent WISH at 72 hpf, probes and colors as indicated. (A-C) Lateral views of midline sagittal orthogonal reconstructions of dorsal view horizontal stacks (levels: yellow line in A′-C′). (A′-C′) Dorsal views, optical horizontal section level indicated in cyan in A-C. (D-D″) Lateral views of combined her6/her9 (her6 and her9 probes mixed) and combined her4/her15 (her4.1-4.5 and her15.1-15.2 probes mixed). (E) Schematic of a 3 dpf zebrafish larval brain (Mueller and Wullimann, 2016). Gray, proliferation zones; dashed line, alar-basal boundary. Red box indicates the thalamic complex, shown enlarged in F. (F) Schematic of her gene expression domains at the ventricular wall of the alar diencephalon. Striped areas indicate that genes are co-expressed or expressing cells intermingled. (G) her4 WISH 72 hpf larva, sagittal optical section. A-P, anterior-posterior; CeP, cerebellar plate; cth, caudal thalamus; D-V, dorsal-ventral; E, epiphysis; Ha, habenula; hyp, hypothalamus; PTd, dorsal part of posterior tuberculum; ptec, pretectum; pth, prethalamus; PTv, ventral part of posterior tuberculum; rh, rhombencephalon; rth, rostral thalamus; T, midbrain tegmentum; tec, tectum opticum; tel, telencephalon; th, thalamus; ZLI, zona limitans intrathalamica. Scale bars: 50 µm. |

her6 and her9 single and double mutants reveal auto- and cross-regulation. (A,B) CRISPR/Cas9 deletion of the bHLH domains in her6 (A) and her9 (B). Straight vertical lines, sgRNA binding sites; scissors, endpoints of the small deletion; half-arrows, genotyping primers. (C-N′) WISH for her6 or her9, genotypes as indicated. (C-N) Lateral single sagittal optical planes. (C′-N′) Dorsal views. n/n indicate numbers of embryos with phenotype shown in panel/total analyzed. (O) qPCR analysis of her6 or her9 expression in her6 and her9 single and double 96 hpf mutants. Data are mean±s.d. *P<0.05, **P<0.01; two-tailed, two-sample equal variance t-test (Table S6). MHB, midbrain-hindbrain boundary; pth, prethalamus; rh, rhombencephalon; tel, telencephalon; th, thalamus. Scale bars: 200 µm. |
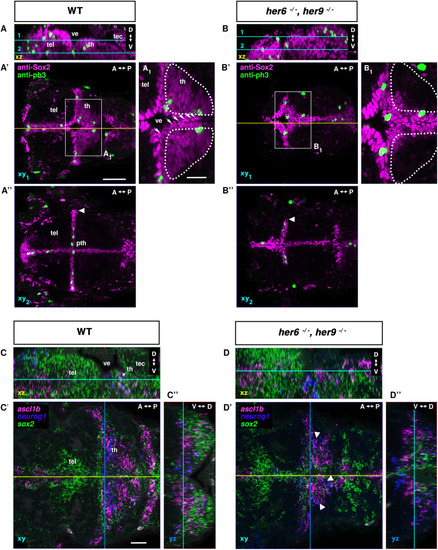
NSC and NPC phenotypes in her6, her9 double mutants. (A-B″) Confocal image stacks of anti-Sox2 and anti-pH3 immunofluorescence of 72 hpf WT control (A) and her6, her9 double mutants (B) (see Movie 2). (C-D″) HCR-RNA FISH for detection of sox2, ascl1b and neurog1 expression. (A-D) Lateral view midline sagittal xz plane from orthogonal reconstructions. Cyan lines show dorsal view horizontal confocal planes 1 and 2 shown in A′-D′, A″,B″ (A′,B′ dorsal part of the diencephalon with the thalamus proper; A″,B″ more ventrally including the prethalamus). Yellow lines in A′-D′ show midline sagittal planes in A-D. A1 and B1 show magnifications of the boxed areas in A′ and B′. (C′,D′) Blue lines show level of frontal orthogonal reconstructions in C″ and D″ (at level of the lateral expansion of the ventricle). Arrowheads in A″ and B″ indicate the lateral expansion of ventricular Sox2high cells. Arrowheads in D′ indicate the compacted expression domain of neurog1 and ascl1b in NPCs of the mutant. A-P, anterior-posterior; D-V, dorsal-ventral; pth, prethalamus; tec, tectum opticum; tel, telencephalon; th, thalamus; ve, ventricle. Scale bars: 50 µm; 20 µm (A1,B1,C′). |

Loss of ZLI shha expression in her6, her9 double mutants. (A-H′) WISH showing shha and ptc1 expression in WT and her6, her9 double mutants. For single mutants, see Fig. S10. (A-D′) Lateral views: single sagittal image planes at the midline. (E-H′) Dorsal views: single horizontal image planes at the level of the thalamus. (I,I′) 3D volume reconstruction of fluorescent WISH of shha in 72 hpf WT (I) and her6, her9 double mutant (I′). A-P, anterior-posterior; D-V, dorsal-ventral; MHB, midbrain-hindbrain boundary; R-L, right-left; tel, telencephalon; th, thalamus; ZLI, zona limitans intrathalamica. Scale bars: 100 µm (A for A-C′,E-G′; D for D,D′,H,H′); 60 µm (I for I,I′). |
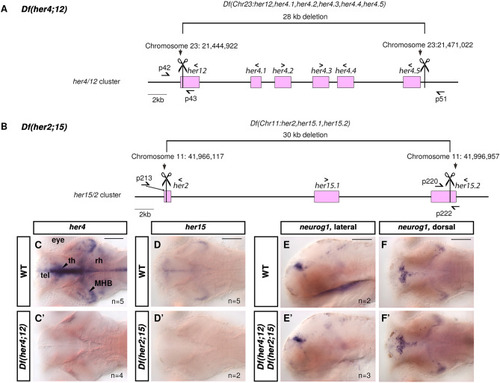
Generation and characterization of Df(her4;12) and Df(her2;15) chromosomal deletions. (A,B) Schematic of CRISPR/Cas9 strategy. Scissors, sgRNA positions; square brackets, deletion;>or<signs, 5′-to-3′ orientations of genes; half-arrows, binding sites genotyping primers. For details see Fig. S12. (C-F′) WISH for her4, her15 and neurog1 mRNAs in 96 hpf larvae, genotypes as indicated (C-D′,F,F′ dorsal view; E,E′ midsagittal optical section). n, embryos analyzed. MHB, midbrain-hindbrain boundary; rh, rhombencephalon; tel, telencephalon; th, thalamus. Scale bars: 100 µm. |

NSC and NPC phenotypes in Df(her4;12), Df(her2;15) double deficiency mutants. (A-B″) Confocal image stacks of anti-Sox2 and anti-pH3 immunostaining in 72 hpf WT (A) and Df(her4;12), Df(her2;15) double mutants (B). (C-D″) HCR-RNA FISH for detection of ascl1a/b, neurog1 and olig2 expression. (A-D) Lateral view midline sagittal xz plane from orthogonal reconstructions. Cyan lines show dorsal view horizontal confocal planes 1 and 2 shown in A′-D′, A″-B″ (A′-D′ dorsal part of the diencephalon with the thalamus proper; A″-B″ more ventrally including the prethalamus). Yellow lines in A′-D′ show midline sagittal planes in A-D. A1 and B1 show magnifications of the boxed areas in A′ and B′, with arrowheads indicating Sox2low-expressing cells. (C′,D′) Blue lines show level of frontal orthogonal reconstructions in C″ and D″ (at level of the lateral expansion of the ventricle). Arrowheads in A″ and B″ indicate the lateral expansion of ventricular Sox2high cells. Arrowheads in C′ and D′ show olig2 in parallel to the ventricular wall and adjacent to neurog1. Arrows show the Sox2high NSC nuclei layer covering the ventricular wall. (E-E″) Anti-Sox2 and anti-pH3 nuclei counts for Notch-dependent (N-dep) and Notch-independent (N-indep) her mutants (Fig. 4; Table S8; Materials and Methods, ‘Microscopy and cell counts’). (E) pH3/Sox2+ count ratios in Sox2high and Sox2low cells. (E′) Sox2high and Sox2low nuclei counts in N-dep and N-indep her mutants. (E″) pH3/Sox2+ nuclei count ratios in Sox2high or Sox2low are not significantly changed in her6,her9 double mutants or double deficiency mutants. Data are mean±s.d. Two sample, unequal variance two-tailed t-tests. Six biological replicates each except WT N-indep (four) replicates; single experiments. A-P, anterior-posterior; D-V, dorsal-ventral; ns, not significant; pth, prethalamus; tec, tectum opticum; tel, telencephalon; th, thalamus; ve, ventricle. A-P, anterior-posterior; D-V, dorsal-ventral; pth, prethalamus; tec, tectum opticum; tel, telencephalon; th, thalamus; ve, ventricle. Scale bars: 50 µm; 20 µm (A1,B1,C′). |

Overexpression of Her4 and Her6 reveals differential cross-regulation of her genes. (A-H′) WISH for her gene expression after heat shock-induced overexpression of Her4 or Her6. WT heat-shocked sibling controls (A-H), Tg(hsp:her4-FLAG) (A′-D′) and Tg(hsp:her6-FLAG) (E′-H′) transgenic embryos. Larvae were heat shocked at 70 hpf for 30 min and fixed at 72.5 hpf, except for G and G′ that were fixed at 71.5 hpf because her6 transcript levels decrease faster after heat shock than her4 transcript levels. her4 probe detects her4.1-4.5. her15 probe detects her15.1 and her15.2. Sagittal optical sections close to midline, anterior at left, dorsal up. pth, prethalamus; rh, rhombencephalon; tec, tectum opticum; tel, telencephalon; th, thalamus; ZLI, zona limitans intrathalamica. Scale bar: 100 µm. |

Overexpression of Her4 and Her6 differentially affect proneural gene expression. (A-J′) Expression of proneural genes and sox2 after heat shock-induced overexpression of Her4 or Her6. Tg(hsp:her4-FLAG) (A′-E′), Tg(hsp:her6-FLAG) (F′-J′) and WT sibling controls (A-J) were heat shocked at 70 hpf for 30 min, embryos fixed at 72.5 hpf. See Table S5 for numbers of embryos analyzed. For B′, E′ and J′ the most representative pattern each are shown (number phenotype shown of total analyzed see bottom right). Sagittal optical sections close to midline, anterior at left, dorsal up. pth, prethalamus; tec, tectum opticum; tel, telencephalon; th, thalamus. Scale bar: 100 µm. |
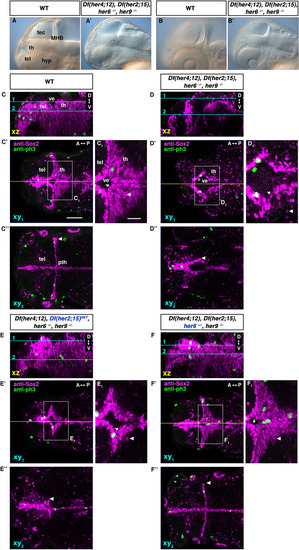
Analysis of the her activity depleted herUDM mutant phenotype reveals prominent role of her6. (A-B′) Live phenotype of WT and Df(her4;12),Df(her2;15),her6,her9 mutant (herUDM) embryos, lateral views at 56 hpf; midsagittal optical section (A), parasagittal optical section at level of lens (B). (C-F″) Anti-Sox2 and anti-pH3 immunofluorescence in 72 hpf embryos, genotypes indicated. (C-F) Lateral view midline sagittal xz plane from orthogonal reconstructions. Cyan lines show dorsal view horizontal confocal planes 1 and 2 shown in C′-F′ and C″-F″, respectively (C′-F′ dorsal part of the diencephalon with the thalamus proper; C″,F″ more ventrally including the prethalamus). (C′-F′) Yellow lines show midline sagittal planes in C-F. C1-F1 show magnifications of boxed areas in C′-F′. Arrowheads in C1-F1 show Sox2low cells. Arrowheads in C″-F″ indicate the lateral expansion of ventricular Sox2high cells. Arrows show the Sox2high nuclei layer covering the ventricular wall. For confocal stacks C/D and E/F see Movies 4 and 5. A-P, anterior-posterior; D-V, dorsal-ventral; tel, telencephalon; th, thalamus; ve, ventricle. Scale bars: 50 µm (C′ for C-F″); 20 µm (C1 for C1-F1). |

Cellular organization, her phenotypes and her genetic interactions in the TPZ. (A-C) Cellular organization in the TPZ. (A) Horizontal plane dorsal view, plane indicated in B, which shows parasagittal section indicated in A. (C) Marker expression. Magenta cells, Sox2high nuclei of the telencephalic ventricular wall, her expression not determined. White cells not analyzed for markers. Gray cells, differentiating early and mature neurons, some of which express neurod family members. (D-G) Schematic of TPZ Sox2 expression in WT and mutants as indicated. Sox2high (NSCs) in dark magenta, Sox2low (NPCs) in light magenta. ‘V’ magenta, Sox2high -and her6 high-expressing cells only present in lateral ventricle wall. Black lines, ventricular surface. Dotted line in G, impairment of ventricle wall integrity. (H) Postulated her gene network interactions. Boxes show analyzed genes and gene expression. Lines indicate how mutations or overexpression influence expression of other genes, interactions may not be direct. Black lines, functional compensation (dot indicates directionality). Dashed black line, partial compensation of her6 and her9 loss. Green inhibition signs, autoregulation of her6 and her9, and postulated negative autoregulation in the her4;her12 and her2;her15 clusters. Blue influence signs, changed Sox2 and neurog1 expression in her6,her9 double mutants. Blue dashed influence sign, loss of Notch-dependent her activity in Df(her4;12),Df(her2;15) only affects Sox2 expression in herUDMs. Red inhibition signs, downregulation of genes upon overexpression of her6 or her4. Dashed red inhibition sign indicates mild downregulation of ascl1b by her4 overexpression. A-P, anterior-posterior; cth, caudal thalamus; D-V, dorsal-ventral; ptec, pretectum; pth, prethalamus (ventral thalamus), rth, rostral thalamus; tec, tectum opticum; tel, telencephalon; th, thalamus; ve, ventricle. |