
- Title
-
Integration of cooperative and opposing molecular programs drives learning-associated behavioral plasticity
- Authors
- Nelson, J.C., Shoenhard, H., Granato, M.
- Source
- Full text @ PLoS Genet.
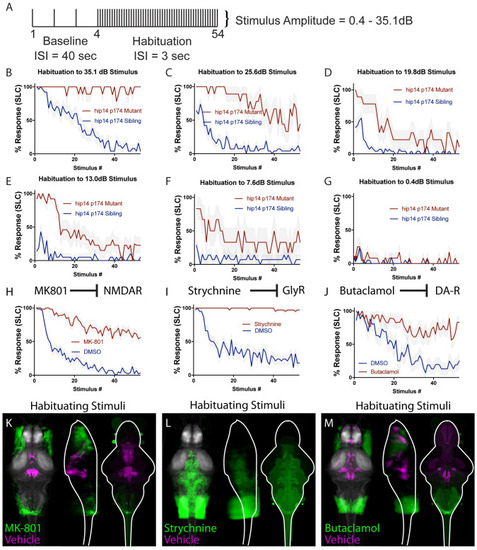
(A) Stimulus paradigm used. ISI for baseline phase is 40 seconds, ISI for habituation phase is 3 seconds. (B)hip14 mutants exhibit a complete failure to habituate to 35.1 dB acoustic stimuli. (C-G) Reduction in stimulus intensity as indicated results in a gradual increase in the ability of hip14 mutants to habituate. (H) MK-801 is an NMDA inhibitor that strongly reduces habituation learning in 5-day old zebrafish larvae (n = 58 DMSO-treated, n = 57 MK-801-treated, stimulus intensity = 35.1dB). (I) Strychnine is a glycine receptor antagonist that strongly reduces habituation learning in 5-day old zebrafish larvae (n = 38 DMSO-treated, n = 38 Strychnine-treated, stimulus intensity = 35.1dB). (J) Butaclamol is a dopamine inhibitor that strongly reduces habituation learning in 5-day old zebrafish larvae (n = 16 DMSO-treated, n = 18 Butaclamol-treated, stimulus intensity = 35.1 dB). (K-M) Regions upregulated by the specified drug treatment under “Habituating Stimuli” conditions are indicated in green; regions upregulated in the vehicle (can also be interpreted as downregulated in drug-treated) are indicated in magenta. In all images, the left panel is a summed z-projection of the whole-brain activity changes. The middle panel is a summed x-projection of the whole brain activity changes. The right panel is a z-projection of the analyzed MAP-map. Molecular targets of pharmacological agents are indicated with diagrams above each column. See S1 Fig for brain activity maps under “No Stimulus” condition and “Non-Habituating Stimuli” condition. Also see S1– S3 Tables for ROIs identified in the experiments presented as well as in an independent replicate of each drug condition. |
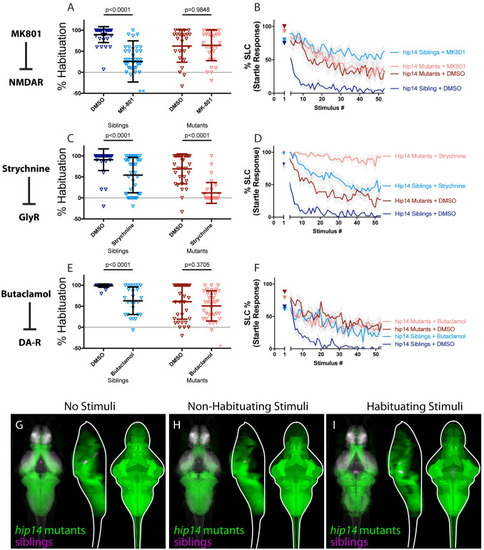
(A-B) MK-801 impairs habituation learning in siblings, (p<0.0001 Sidak’s test for multiple comparisons, n = 38 DMSO, n = 38 MK-801), but does not enhance habituation learning deficits observed in hip14 mutant larvae (p = 0.9848, n = 24 DMSO, n = 29 MK-801, p<0.0001 indicates significant interaction between drug treatment and genotype; these and all subsequent statistical analyses use Two-way ANOVA with Sidak’s multiple comparisons test unless otherwise indicated). **indicate sibling+MK801 individuals with % hab values below y-axis limit at -100% and -180%. (C-D) Strychnine significantly enhances habituation learning deficits observed in hip14 mutant larvae, indicating that glycine signaling and hip14 may act within parallel molecular or circuit pathways to regulate habituation learning (p<0.0001, n = 40 DMSO-siblings, n = 42 Strychnine-siblings, n = 32 DMSO-mutants, n = 32 Strychnine-mutants, p = 0.0639 indicates non-significant interaction between drug treatment and genotype). (E-F) Butaclamol impairs habituation learning in siblings (p<0.0001, n = 33 DMSO, n = 26 Butaclamol), but does not enhance habituation learning deficits observed in hip14 mutant larvae (p = 0.3705, n = 34 DMSO, n = 35 Butaclamol, p = 0.0239 indicates significant interaction between drug treatment and genotype), indicating that dopamine receptor signaling and hip14 may act within the same molecular or circuit pathway to regulate habituation. *indicates a mutant+butaclamol individual with % hab value below y-axis limit at -60%. (G-I) Regions upregulated in hip14 mutants are indicated in green; regions upregulated in siblings (can also be interpreted as downregulated in hip14 mutants) are indicated in magenta. In all images, the left panel is a summed z-projection of the whole-brain activity changes. The middle panel is a summed x-projection of the whole brain activity changes. The right panel is a z-projection of the analyzed MAP-map. Patterns of neuronal activity are similar between “No Stimuli” vs “Non-Habituating Stimuli” vs. “Habituating Stimuli” (restricted diencephalic downregulation of activity; nearly global upregulation of activity across the telencephalon, diencephalon, and rhombencephalon). See also S1–S3 Tables for ROIs up- and down-regulated in each condition, as well as in independent replicates. |

(A-B) MK-801 significantly enhances habituation learning deficits in kcna1a mutants and siblings (p<0.0001, n = 42 DMSO-siblings, n = 46 MK-801-siblings, p = 0.0128, n = 8 DMSO-mutants, n = 20 MK-801 mutants, p = 0.2628 indicates non-significant interaction between drug treatment and genotype). (C-D) Strychnine significantly enhances habituation learning deficits in kcna1a mutants and siblings (p<0.0001, n = 24 DMSO-siblings, n = 31 Strychnine-siblings, p<0.0001, n = 35 DMSO-mutants, n = 26 Strychnine-mutants, p = 0.1063 indicates non-significant interaction between drug treatment and genotype). (E-F) Butaclamol significantly enhances habituation learning deficits in kcna1a mutants and siblings (p<0.0001, n = 30 DMSO-siblings, n = 37 Butaclamol-siblings, p = 0.0018, n = 30 DMSO-mutants, n = 27 Butaclamol-mutants, p = 0.3942 indicates non-significant interaction between drug treatment and genotype). *indicate a sibling+butaclamol and a mutant+butaclamol individual with % hab values below y-axis limit at -100% and -60% respectively. (G-I) Regions upregulated in kcna1a mutants are indicated in green; regions downregulated in kcna1a mutants are indicated in magenta. In all images, the left panel is a summed z-projection of the whole-brain activity changes. The middle panel is a summed x-projection of the whole brain activity changes. The right panel is a z-projection of the analyzed MAP-map. We observed similar patterns of neuronal activity induced by “no stimuli” vs “non-habituating stimuli” vs. “habituating stimuli”: highly restricted upregulation of activity in the spiral fiber neuron clusters as well as in V2A (including Rom3) neurons. See also S1–S3 Tables for ROIs up- and down-regulated in each condition, as well as in independent replicates. |
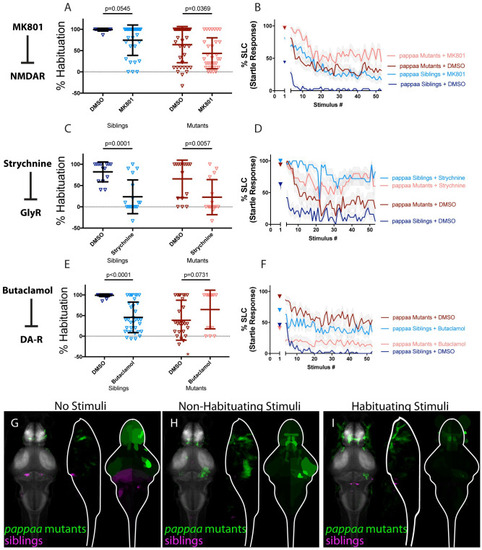
(A-B) MK-801 significantly enhances habituation learning deficits observed in pappaa mutant larvae, indicating that NMDA signaling and pappaa may act within parallel molecular or circuit pathways to regulate habituation learning (p = 0.0369, n = 39 DMSO-mutants, n = 32 MK-801 mutants; p = 0.0545, n = 16 DMSO-siblings, n = 31 MK-801 siblings; p = 0.7637 indicates non-significant interaction between drug treatment and genotype). (C-D) Strychnine significantly enhances habituation learning deficits observed in pappaa mutant larvae, indicating that glycine signaling and pappaa may act within parallel molecular or circuit pathways to regulate habituation learning (p = 0.0057, n = 16 DMSO-mutants, n = 15 Strychnine-mutants; p = 0.0001, n = 14 DMSO-Siblings, n = 18 Strychnine-siblings; p = 0.4286 indicates non-significant interaction between drug treatment and genotype). (E-F) Butaclamol does not significantly enhance habituation learning deficits observed in pappaa mutant larvae, but rather trends toward significantly restoring habituation learning (p<0.0001, n = 31 DMSO-siblings, n = 35 Butaclamol-siblings; p = 0.0731, n = 28 DMSO mutants, n = 13 Butaclamol mutants; p<0.0001 indicates significant interaction between drug treatment and genotype). *indicates a mutant+DMSO individual with % hab value below y-axis limit at -100% (G-I) Regions upregulated in pappaa mutants are indicated in green; regions downregulated in pappaa mutants are indicated in magenta. In all images, the left panel is a summed z-projection of the whole-brain activity changes. The middle panel is a summed x-projection of the whole brain activity changes. The right panel is a z-projection of the analyzed MAP-map. Patterns of neuronal activity are similar between “no stimuli” vs “non-habituating stimuli” vs. “habituating stimuli” (increased activity within the telencephalon and hypothalamus; decreased activity within multiple rhombencephalic loci). This pattern is somewhat inverted relative to that observed in Butaclamol-treated animals, consistent with a role for pappaa in regulating dopamine signaling. See also S1–S3 Tables for ROIs up- and down-regulated in each condition, as well as in independent replicates. |

(A-B) MK-801 significantly enhances habituation learning deficits observed in cacna2d3 mutant larvae, indicating that NMDA signaling and cacna2d3 may act within parallel molecular or circuit pathways to regulate habituation learning (p = 0.0010, n = 28 DMSO siblings, n = 27 MK-801 siblings, vs. p<0.0001, n = 31 DMSO mutants, n = 41 MK-801 mutants; p = 0.5130 indicates non-significant interaction between drug treatment and genotype). *indicates a sibling+MK801 individual with a % hab value below y-axis limit at -60% (C-D) Strychnine significantly enhances habituation learning deficits observed in cacna2d3 mutant larvae, indicating that glycine signaling and cacna2d3 may act within parallel molecular or circuit pathways to regulate habituation (p = 0.6012, n = 15 DMSO siblings, n = 21 Strychnine siblings vs. p<0.0001, n = 22 DMSO mutants, n = 19 Strychnine mutants; p<0.0001 indicates significant interaction between drug treatment and genotype owing to minimal reaction of cacna2d3 siblings to Strychnine treatment). (E-F) Butaclamol does not significantly enhance habituation learning deficits observed in cacna2d3 mutant larvae (p = 0.0143, n = 20 DMSO siblings, n = 24 Butaclamol siblings, vs. p = 0.0527, n = 43 DMSO mutants, n = 35 Butaclamol mutants; p = 0.4035 indicates non-significant interaction between drug treatment and genotype). Inspection of the learning curves (F) reveals a dramatic difference in the learning curves of mutants with or without drug. *indicate 2 sibling+Butaclamol and 2 mutant+Butaclamol individuals with % hab value below y-axis limit at -100%, -60%, -256%, and -80% respectively. (G-I) Regions upregulated in cacna2d3 mutants are indicated in green; regions downregulated in cacna2d3 mutants are indicated in magenta. In all images, the left panel is a summed z-projection of the whole-brain activity changes. The middle panel is a summed x-projection of the whole brain activity changes. The right panel is a z-projection of the analyzed MAP-map. Unlike other mutants, cacna2d3 mutants do not exhibit reproducible changes in neuronal activity relative to their siblings in any stimulation condition. See also S1–S3 Tables for ROIs up- and down-regulated in each condition, as well as in independent replicates. |
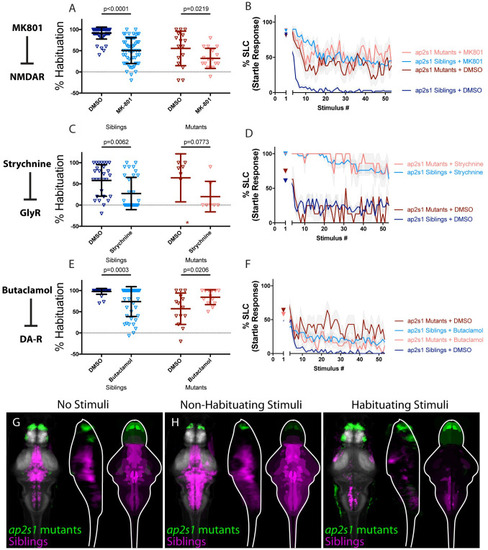
(A-B) MK-801 significantly enhances habituation learning deficits observed in ap2s1 mutant larvae, indicating that NMDA signaling and ap2s1 may act within parallel molecular or circuit pathways to regulate habituation (p<0.0001, n = 54 DMSO Siblings, n = 58 MK-801 siblings; p = 0.0219, n = 16 DMSO mutants, n = 17 MK-801 mutants; p = 0.0875 indicates non-significant interaction between drug treatment and genotype). (C-D) Strychnine trends toward enhancing habituation learning deficits observed in ap2s1 mutant larvae (p = 0.0062, n = 29 DMSO siblings, n = 33 Strychnine siblings; p = 0.0773, n = 7 DMSO mutants, n = 7 Strychnine mutants; p = 0.5651 indicates non-significant interaction between drug treatment and genotype). Inspection of learning curves in (D) shows dramatic differences between vehicle and drug-treated larvae, indicating that glycine signaling and ap2s1 act within parallel molecular or circuit pathways to regulate habituation learning. *indicates a mutant+DMSO individual with a % hab value below y-axis limit at -60% (E-F) While Butaclamol inhibits habituation learning in siblings (p = 0.0003, n = 36 DMSO siblings, n = 42 Butaclamol siblings) it does not significantly enhance habituation learning deficits in ap2s1 mutant larvae. Rather, ap2s1 mutant animals learn significantly more robustly in the presence of the normally habituation-blocking Butaclamol (p = 0.0206, n = 14 DMSO mutants, n = 13 Butaclamol mutants; p<0.0001 indicates significant interaction between drug treatment and genotype). (G-I) Regions upregulated in ap2s1 mutants are indicated in green; regions downregulated in ap2s1 mutants are indicated in magenta. In all images, the left panel is a summed z-projection of the whole-brain activity changes. The middle panel is a summed x-projection of the whole brain activity changes. The right panel is a z-projection of the analyzed MAP-map. Consistent with the even stronger effect of Butaclamol in driving habituation learning in ap2s1 mutants relative to pappaa mutants, ap2s1 mutant animals exhibit an even more dramatically inverted pattern relative to Butaclamol-treated animals. ap2s1 mutant animals exhibit robust upregulation in the telencephalon (while Butaclamol-treated animals show downregulation here). Similarly, ap2s1 mutants show dramatically downregulated activity within the rhombencephalon, while our Butaclamol results indicate that dopamine inhibition upregulates activity here. See also S1–S3 Tables for ROIs up- and down-regulated in each condition, as well as in independent replicates. |

(A) Summed Z-projection of Th signal within the olfactory bulb obtained from the Z-brain Atlas [31]. (A’) Representative example of a summed projection from a single experiment showing regions of increased activity within the olfactory bulb in ap2s1 mutants relative to their siblings during habituation learning. (A”) A merge of A and A’ showing co-registration of Th-immunoreactive areas and regions of increased activity in ap2s1 mutants relative to siblings during habituation. Areas of increased activity in ap2s1 mutants during habituation learning show strong overlap with Th-immunoreactive olfactory bulb regions. (B) A single z-plane through the olfactory bulb Th-stained area shown in (A). (B’) The same z-plane as in B taken from the stack in A’ showing regions of increased activity within the olfactory bulb in ap2s1 mutants relative to their siblings during habituation learning. (B”) Merge of (B) and (B’). The x-y overlap indicated in |

(A) Module 1 (purple) comprises hip14, NMDA, and dopamine receptors. Module 2 (aqua) comprises hip14 and kcna1a. Module 3 (pink) comprises ap2s1, pappaa, and dopamine receptors. Modules 4 and 5 are comprised of cacna2d3 and glycine receptor signaling acting in parallel to all other modules. (B) Regions commonly upregulated by dopamine inhibition, NMDA inhibition, and mutations in hip14 are indicated in purple. (C) Regions upregulated by mutations in kcna1a and hip14 are indicated in blue. (D) Regions downregulated by dopamine receptor inhibition and upregulated by mutations in ap2s1 or pappaa are indicated in pink. Regions upregulated by dopamine receptor inhibition and downregulated by mutations in pappaa or ap2s1 are indicated in yellow. See also S3 Fig for cluster analysis heat map and correlations between pharmacogenetic treatments. In (B-D), signal intensity is proportional to the sum of the absolute intensity values. Abbreviations in (B): NP2 = Rhombencephalon–Neuropil Region 2, X vagus mn cluster = Rhombencephalon—X Vagus motorneuron cluster, Gad1b S = Rhombencephalon Gad1b Stripe 2, NP3 = Rhombencephalon Neuropil Region 3, NNIV = Rhombencephalon—Noradrendergic neurons of the Interfascicular and Vagal areas, Vmat2 S1 = Spinal Cord—Vmat2 Stripe1, Hcrtr S = Spinal Cord—6.7FDhcrtR-Gal4 Stripe, Gad1b S1 = Spinal Cord—Gad1b Stripe 1, R7 = Rhombomere 7, Hcrtr Clust 5 = Rhombencephalon—6.7FDhcrtR-Gal4 Cluster 5, Area postrema = Rhombencephalon Area Postrema, Gad1b Clust 20 = Rhombencephalon—Gad1b Cluster 20. Abbreviations in (C): SF anterior = Rhombencephalon—Spiral Fiber Neuron Anterior cluster, SF posterior = Rhombencephalon—Spiral Fiber Neuron Posterior cluster, Oxtl Clust MC Axon Cap = Rhombencephalon—Oxtl Cluster 2 Near MC axon cap, RoM2 = Rhombencephalon—RoM2, RoM3 = Rhombencephalon–RoM3, MiM1 = Rhombencephalon—MiM1. Abbreviations in (D): DO = Telencephalon—Olfactory bulb dopaminergic neuron areas, Gad1b-C = Telencephalon—Subpallial Gad1b cluster, Isl1-C = Telencephalon—Isl1 clusters 1 and 2, OB = Telencephalon—Olfactory Bulb, Subpall = Telencephalon–Subpallium, Pallium = Telencephalon–Pallium, Vmat2-S = Rhombencephalon—Vmat2 Stripe2, GlyT2-S = Rhombencephalon—Glyt2 Stripe 2, Isl1b-S = Rhombencephalon Isl1 Stripe1, Gad1b-C = Rhombencephalon—Gad1b Cluster 20, Gad1b-S = Rhombencephalon—Gad1b Stripe 2, TH-C = Rhombencephalon—Small cluster of TH stained neurons |