
- Title
-
Investigating Potential Cardiovascular Toxicity of Two Anti-Leukemia Drugs of Asciminib and Ponatinib in Zebrafish Embryos
- Authors
- Lin, H.C., Saputra, F., Audira, G., Lai, Y.H., Roldan, M.J.M., Alos, H.C., Aventurado, C.A., Vasquez, R.D., Tsai, G.J., Lim, K.H., Hsiao, C.D.
- Source
- Full text @ Int. J. Mol. Sci.

Schematic diagram showing the overall experimental design for the study. The upper panel shows the timing and workflow to conduct cardiovascular assessments in zebrafish. The bottom panel shows the physiological and molecular endpoints used to evaluate the potential adverse effect of the tested chemicals. |

The morphology of 72 hpf zebrafish larvae after acute exposure in 0 ( |
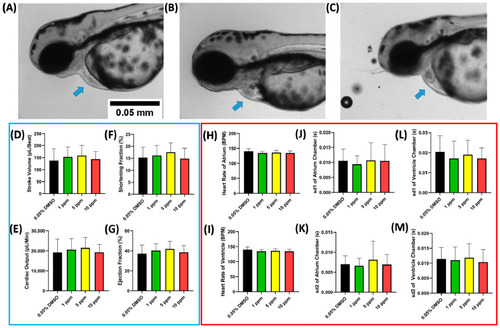
The morphology of 72 hpf zebrafish larvae after acute exposure in 0 ( |

The morphology of 72 hpf zebrafish larvae after acute exposure in 0 ( |

Representative of zebrafish larvae blood flow oscillation pattern after incubation in 0.05% DMSO (grey), 0.5 (green), 1 (yellow), and 1.5 (red) ppm of PON (dash line show the average velocity) ( |

Representative zebrafish larvae blood flow oscillation pattern after incubation in 0.05% DMSO (grey), 10 ppm of ASC (yellow), 0.5 ppm of PON (red), and a combination of both compound (orange) (dash line show the average velocity) ( |

Relative mRNA level of cardiovascular-related genes in zebrafish after exposure to ASC, PON, and combining both compounds. Some molecular makers associated with cardiac development ( |