
- Title
-
Identification and functional characterization of BICD2 as a candidate disease gene in an consanguineous family with dilated cardiomyopathy
- Authors
- Luo, K., Zheng, C., Luo, R., Cao, X., Sun, H., Ma, H., Huang, J., Yang, X., Wu, X., Li, X.
- Source
- Full text @ BMC Med. Genomics
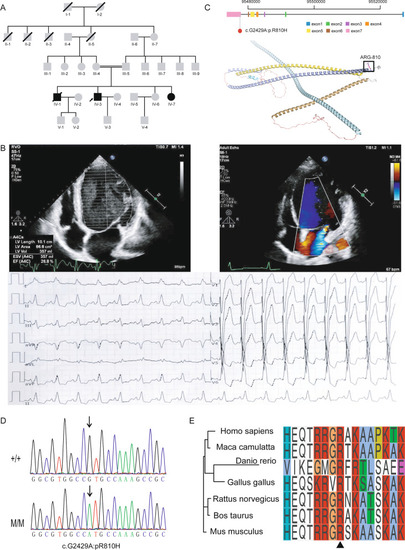
Family pedigree and clinical phenotypes. A. Pedigree of the consanguineous family affected by DCM inherited in an autosomal recessive pattern. square represents male and circle represents female. Grey square/circles represent healthy members without DCM. Black square/circles represent DCM patients. The proband is indicated by an arrow. Square/circles with slash sign represent deceased males/females. B. Echocardiography and electrocardiogram images of the proband showing dilated heart and decreased LVEF. Upper left panel: parasternal long-axis echocardiogram view of the left ventricle showing two-dimensional measurements of right and left ventricular wall thickness, septal thickness and right and left ventricular internal diameter. Upper right panel: apical four chamber echocardiogram view showing length, area, volume, end-systolic volume (ESV) and ejection fraction of the left ventricle. Lower panel: 12-lead electrocardiogram (ECG) showing paroxysmal sinus tachycardia and complete left bundle branch block. C. Candidate DCM variant in BICD2. Upper panel: the variant located in exon 7 of BICD2. Lower panel: location of the variant in the BICD2 protein 3D structure predicted by the AlphaFold algorithm. D. Sanger sequencing results indicating the genotypes of the family members. Arrows indicate the variant locus. E. Protein sequence alignment of the amino acid sequences surrounding the BICD2 variant with orthologues from H. sapiens to Danio rerio. Note that the amino acid sequences surrounding the affected amino acid residues are highly conserved |
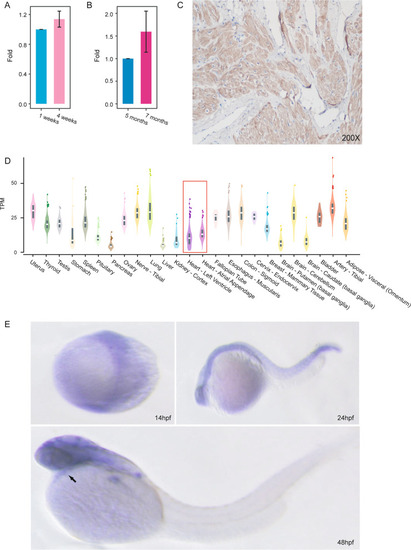
Expression of BICD2 in human, mouse and zebrafish heart tissues. A. qPCR of Bicd2 in the hearts of C57 mice suggested an increasing trend in expression over the course of development (n = 3). Data are represented as the mean ± SD. B. qPCR of BICD2 in the hearts of zebrafish suggested an increasing trend in expression over the course of development (n = 3). Data are represented as the mean ± SD. C. Immunohistochemistry with anti-BICD2 antibody of normal human heart showing ubiquitous staining. D. Bulk RNA-seq revealed the mRNA expression level (transcripts per million fragments) of BICD2 in multiple tissues from humans. E. In situ hybridization of bicd2 in zebrafish revealed that bicd2 was expressed in the heart at the embryonic stage |
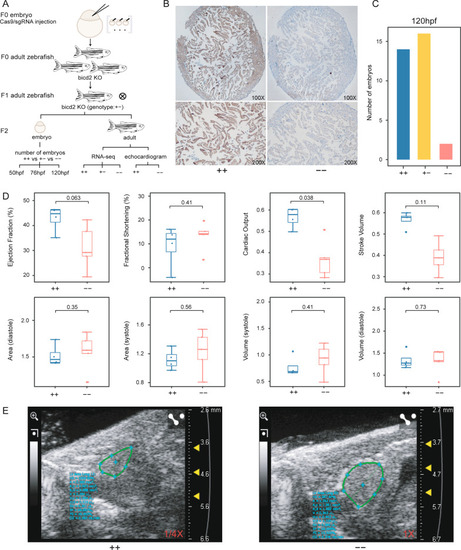
DCM-associated phenotypes in bicd2-deficient zebrafish. A. Flow chart of bicd2 zebrafish model development for functional experiments. B. Immunohistochemistry of zebrafish hearts with anti-BICD2 antibody showing the absence of staining in bicd2–fish and ubiquitous staining in wild-type fish. C. Number of homozygous (n = 2), heterozygous (n = 16) and wild-type (n = 14) embryos at 120 hdf. D. Boxplot showing indices of ventricular size, including area, volume, ejection fraction, fractional shortening, cardiac output, and stroke volume, in homozygotes (n = 5) and wild-type fish (n = 4). The lower and upper hinges correspond to the 25th and 75th quartiles. The upper whisker extends from the upper hinge to the largest value no further than 1.5 × IQR from the hinge; The lower whisker extends from the hinge to the smallest value at most 1.5 × IQR of the hinge. Data beyond the end of the whiskers are "outlying" points and are plotted individually. IQR(the inter-quartile range): distance between the first and third quartiles. E. Echocardiogram plot showing ejection fraction difference between a homozygous mutant and a wild-type fish |
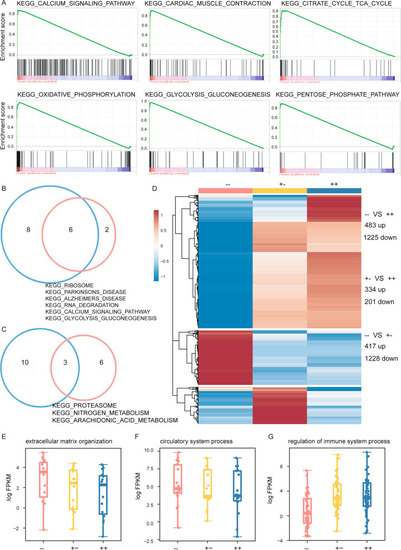
bicd2-deficient hearts exhibited cardiac transcriptome shift. A. GSEA plots of six KEGG pathways showing higher expression in bicd2 zebrafish. B. Venn diagrams showing enriched KEGG pathways among genes with increased expression in the bicd2-deficient groups. C. Venn diagrams showing enriched KEGG pathways among genes with decreased expression in the bicd2-deficient groups. D. Differentially expressed genes in the two bicd2-deficient groups. Cells are filled according to z score: red indicates higher (activated), blue indicates lower (inhibited). E. Differentially expressed genes involved in extracellular matrix organization. Cells are filled according to z score: red indicates higher (activated), blue indicates lower (inhibited). F. Differentially expressed genes involved in circulatory system processes. Cells are filled according to z score: red indicates higher (activated), blue indicates lower (inhibited). G. Differentially expressed genes involved in the regulation of immune system processes. Cells are filled according to z score: red indicates higher (activated), blue indicates lower (inhibited) |

ZFIN is incorporating published figure images and captions as part of an ongoing project. Figures from some publications have not yet been curated, or are not available for display because of copyright restrictions. |