FIGURE SUMMARY
Title

Dynamics and potential significance of spontaneous activity in the habenula

Authors
Suryadi, ., Cheng, R.K., Birkett, E., Jesuthasan, S., Chew, L.Y.
Source
Full text @ eNeuro

Characterization of neuronal avalanches in the habenula. A, The habenula of Tg(elavl3:H2B-GCaMP6s) fish, imaged at 15 Hz. Scale bar, 25 μm. B, Population statistics (mean and standard deviation, SD) of the neuron average firing rate aggregated over all recordings. The individual firing rate distributions for each recording are given in Extended Data Figure 1-1. C, Activity in a subset of neurons in the habenula imaged at 15 Hz. The black lines indicate frames where there is at least one spike inferred by MLspike. D, Plot showing number of spikes across the population as inferred by MLspike. E, F, Inferred spikes, obtained from imaging a single plane at 113 Hz. E is the entire recording, whereas F is a zoomed in version to a portion. G, H, Distribution of avalanche size (G) and duration (H) in fish imaged at 113 Hz at a single plane. The blue curve is based on data from one fish, while the orange curve is derived from a second fish. The log-log plots are not linear, indicating the absence of a power law. Further avalanche analyses are given in Extended Data Figure 1-2.

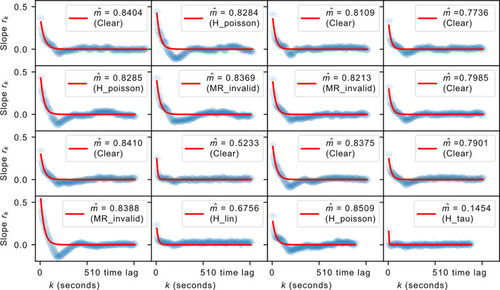
The regression slopes rk at different time lags k. The blue curve represents actual data, whereas the red curve is the fit using the estimated m^ based on Equation 2. The value of the estimated m^ is shown alongside the results for stationarity tests—datasets that pass all the tests are denoted as Clear while those that fail at least one are indicated by the first test they failed. For relatively short datasets, even a stationary branching process can test positive for Hpoisson and HMR_invalid, as shown in Extended Data Figure 2-1.

Inferred m^ values of the accepted datasets as well as temporally subsampled data. There is a systematic downward trend with increasing time bin Δt size consistent with theoretical expectations. The theoretical fit (without the three outliers) is shown as a red dashed line. This trend is not by chance, as time-shuffled data indicate Poisson activity regardless of Δt (Extended Data Fig. 3-1).

Effect of spatial subsampling on m^. The estimated branching parameter m^ for each dataset is labeled and ordered by its sampling rate at different subsample ratios. The one point in black failed a stationarity test. We see that, contrary to expectation, there appears to be systematic underestimation of m^ with spatial subsampling. We further investigate this in Extended Data Figure 4-1.

Autocorrelation time in the habenula. The autocorrelation time τ (in seconds) for each of the accepted datasets, labeled and sorted by the recording sampling rate. The box plot on the right shows the aggregated statistics of these values.

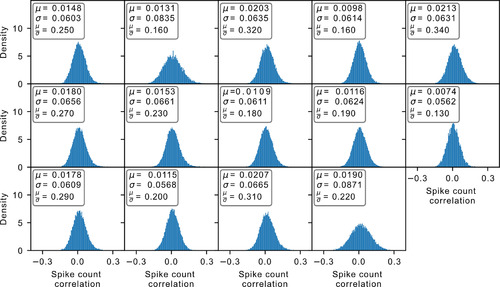
Spike count correlation distribution. Each panel indicates the distribution of a different dataset. For all the accepted datasets, the mean μ is significantly smaller than the width σ of the distribution. This finding is also consistent with further spatial subsampling of the system (Extended Data Fig. 6-1).

PCA explained variance ratio for the accepted datasets. All cases display a gradual decline instead of just a single dominant contribution, with the effective dimensions being significantly >1. In addition, activity along the different principal components have heterogeneous loadings (Extended Data Fig. 7-1). These deviate from what is expected from a neural system with critical avalanches.

The largest eigenvalue λmax of the connectivity matrix. The computation of λmax requires the binning of the spikes into time bins. This plot shows the results obtained after binning the spikes into 2 s bins, as well as binning into different sizes for each dataset according to its own autocorrelation time τ. In both cases, the λmax values lie well below the critical point at λmax = 1.

Acknowledgments
This image is the copyrighted work of the attributed author or publisher, and ZFIN has permission only to display this image to its users. Additional permissions should be obtained from the applicable author or publisher of the image. Full text @ eNeuro