
- Title
-
High-Throughput Imaging of Blood Flow Reveals Developmental Changes in Distribution Patterns of Hemodynamic Quantities in Developing Zebrafish
- Authors
- Maung Ye, S.S., Kim, J.K., Carretero, N.T., Phng, L.K.
- Source
- Full text @ Front. Physiol.
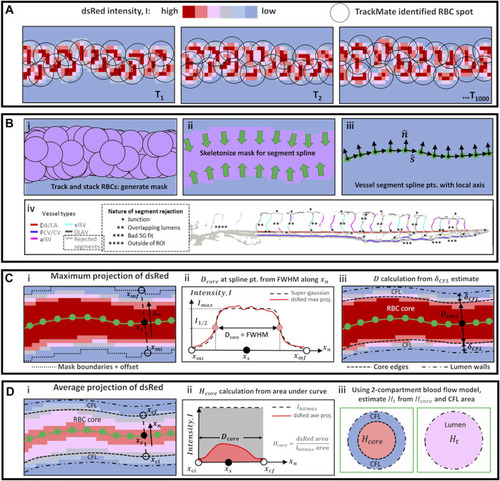
Schematic diagrams of methods used for automated vessel labeling, data filtering, and vessel diameter and hematocrit calculation. |

Series of script-automated steps to obtain peak (systolic) RBC velocity from TrackMate data, demonstrated using data from zebrafish 28 of the 2 dpf data set. |
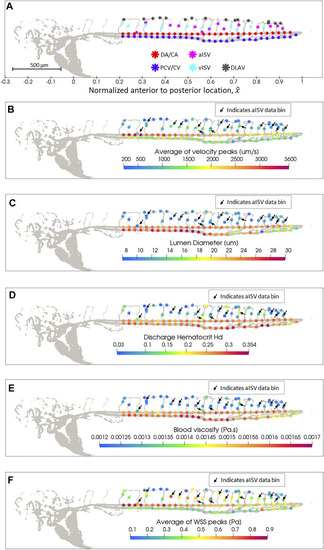
Spatial distribution map of data in zebrafish 28 of the 2 dpf data set after automated spatial bin averaging: |
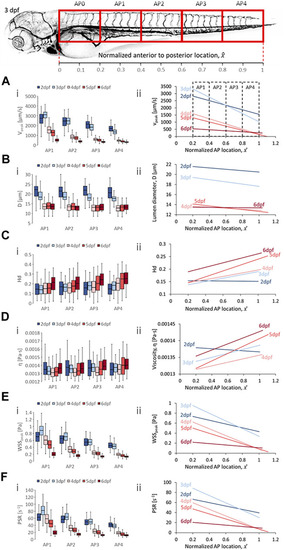
Developmental trends of morphological and hemodynamic quantities in the dorsal aorta/caudal artery (DA/CA). |
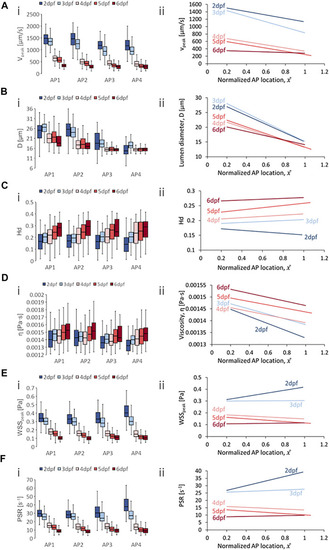
Developmental trends of morphological and hemodynamic quantities in the posterior cardinal vein/caudal vein plexus (PCV/CVP). |

Developmental trends of morphological and hemodynamic quantities in the arterial intersegmental vessels (aISVs). |

Developmental trends of morphological and hemodynamic quantities in the venous intersegmental vessels (vISVs). |

Developmental trends of morphological and hemodynamic quantities in the dorsal longitudinal anastomotic vessel (DLAV). |

Developmental patterns of the anterior-to-posterior (AP) gradients in morphological and hemodynamic quantities in the zebrafish trunk vasculature. Circles indicate the hemodynamic AP gradient obtained from linear regression fitting of the pooled AP data, whisker bars indicate the standard error of the regression and * symbols denote statistically significant gradients from the slope T-test ( |
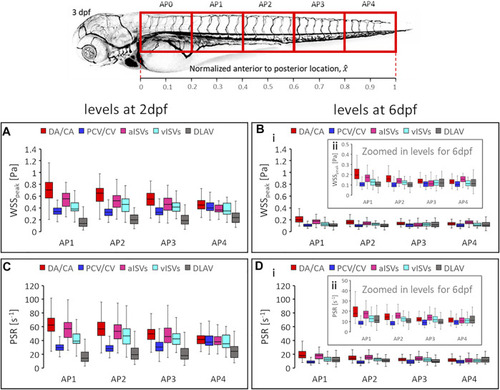
Developmental changes in magnitude levels of shear rate related quantities. The |