
- Title
-
Physiologically Based Toxicokinetic Modeling of Bisphenols in Zebrafish (Danio rerio) Accounting for Variations in Metabolic Rates, Brain Distribution, and Liver Accumulation
- Authors
- Chelcea, I., Örn, S., Hamers, T., Koekkoek, J., Legradi, J., Vogs, C., Andersson, P.L.
- Source
- Full text @ Env. Sci. Tech.

PBTK model structure for adult female zebrafish adopted from Grech et al.27 Solid arrows represent mass balance flows between organs, and dashed arrows represent possible elimination pathways. Colored compartments represent organs for which experimental data were available. Abbreviated compartment names are richly perfused tissue (RPT), poorly perfused tissue (PPT), and gastrointestinal (GI) tract/lumen. |
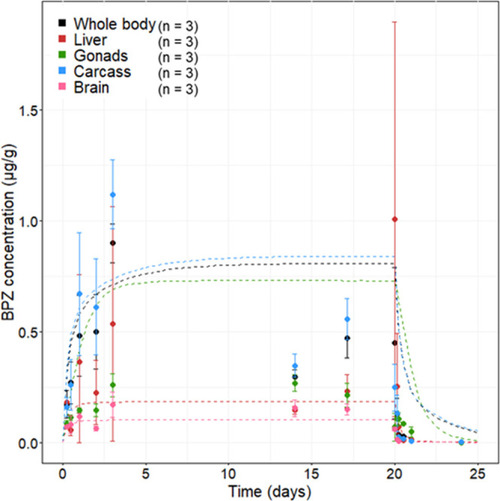
Measured internal BPZ concentrations in the liver, ovaries, brain, carcass, and whole body in female zebrafish exposed to 17 μg/L BPZ in water for 20 days with a 4-day depuration period. Dots represent measured data with error bars showing standard deviation and dotted lines represent PBTK model prediction. Observed whole-body concentrations past 24 h are calculated based on the sum of compounds in the carcass and organs and their corresponding fractions of bodyweight (measured for each individual fish). |
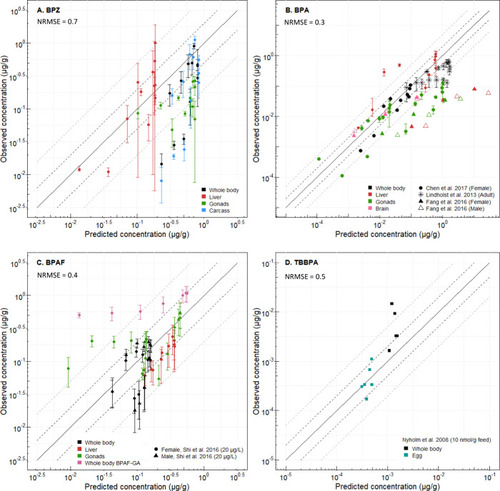
Measured versus predicted organ and whole-body concentrations (μg compound/g fish) of (A) BPZ, (B) BPA, (C) BPAF and BPAF-GA, and (D) TBBPA in zebrafish. Experimental data for BPA were obtained from Lindholst et al.39 (n = 4), Chen et al.43 (n = 3 of 5 pooled fish each), and Fang et al.44 (n = 3 of 5 pooled fish each), for BPAF and BPAF-GA from Shi et al.47 (n = 4), and for TBBPA from Nyholm et al.46 (n = 1 of 2 pooled individuals). The solid line represents 1:1 correlation and dotted lines represent the 5-fold (gray) and 2-fold (black) errors. NRMSE was calculated for all organs combined without the inclusion of metabolites or data used for fitting. Data used for fitting parameters were not included in the graphs. |