
FIGURE SUMMARY
- Title
-
Effects of long-term exposure to TDCPP in zebrafish (Danio rerio) - Alternations of hormone balance and gene transcriptions along hypothalamus-pituitary axes
- Authors
- Liu, X., Lu, X., Hong, J., Zhang, J., Lin, J., Jiang, M., Liu, Q., Choi, K., Zhang, J.
- Source
- Full text @ Animal Model Exp Med

Effects of TDCPP on plasma cortisol (A), follicle stimulating hormone (FSH) (B), and leutinizing hormone (LH) (C) levels in female and male fish after 120 days’ exposure. Data are expressed as mean ± SD of six replicates. Asterisk indicates significant difference from solvent control (SC, treated with 0.005% DMSO). The P value was determined based on ANOVA analysis
|

Effects of TDCPP on plasma sex hormone levels of 17-estradiol (E2) (A), testosterone (T) (B), 11-ketotestosterone (11-KT) (C), E2/T ratio (D), E2/11-KT ratio (E) in females and males after 120 days’ exposure. Data are expressed as mean ± SD of five replicates. Asterisk indicates significant difference from solvent control (SC, treated with 0.005% DMSO). The P value was determined based on ANOVA analysis
|
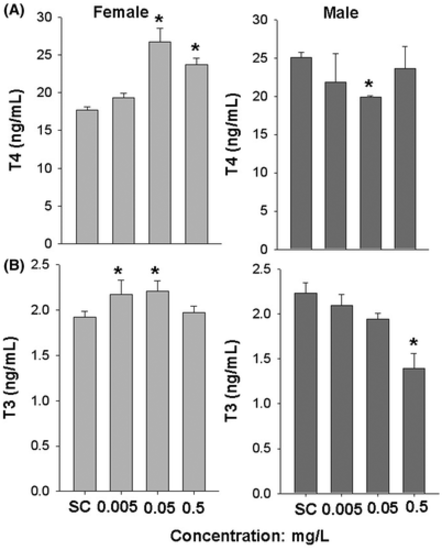
Effects of TDCPP on plasma thyroxine (T4) (A) and triiodothyronine (T3) (B) levels in female and male fish after 120 days’ exposure. Data are expressed as mean ± SD of three replicates. Asterisk indicates significant difference from solvent control (SC, treated with 0.005% DMSO). The P value was determined based on ANOVA analysis
|

Sex-dependent response profile in adult zebrafish after exposure to TDCPP. Gene expression data from zebrafish treated with 0.005, 0.05 and 0.5 mg TDCPP/L are colour coded for the selected endocrine pathways along the zebrafish HPG, HPI, and HPT axes. Red: significantly up-regulated; Green: significantly down-regulated
|
Acknowledgments
This image is the copyrighted work of the attributed author or publisher, and
ZFIN has permission only to display this image to its users.
Additional permissions should be obtained from the applicable author or publisher of the image.
Full text @ Animal Model Exp Med