FIGURE SUMMARY
Title

Trap-TRAP, a Versatile Tool for Tissue-Specific Translatomics in Zebrafish

Authors
Corbacho, J., Sanabria-Reinoso, E., Buono, L., Fernández-Miñan, A., Martínez-Morales, J.R.
Source
Full text @ Front Cell Dev Biol

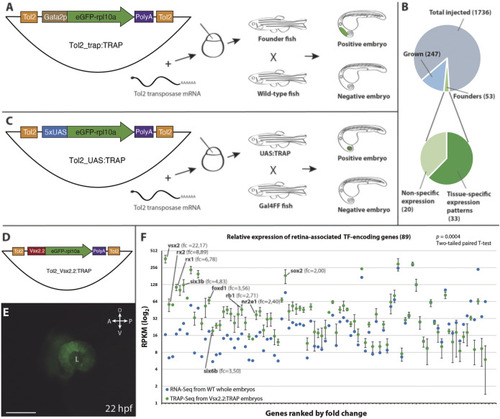
Vectors and procedures used to expand TRAP approaches in zebrafish.(A): The Tol2_trap:TRAP vector comprises a cassette containing the eGFP-rpl10a fusion gene (green) and the gata2p minimal promoter (brown), flanked by Tol2 recognition sequences (orange). This vector was injected together with Tol2 transposase mRNA in one-cell stage zebrafish embryos. Once grown, adult fish were screened for eGFP-rpl10a expression in their progeny. (B): Pie charts showing the efficiency rate of the trap:TRAP approach. (C): The Tol2_UAS:TRAP vector comprises a cassette that contains the eGFP-rpl10a fusion gene (green) together with the 5xUAS element (blue), flanked by the Tol2 recognition sequences (orange). This vector together with Tol2 transposase mRNA were injected together in one-cell stage embryos. Once grown, adult fish were outcrossed with a Gal4 line to identify founders. (D): Schematic representation of the Tol2_vsx2.2:TRAP vector used to test the functionality of the eGFP-rpl10a cassette (green) under the control of the vsx2.2 promoter (red). (E): Retina-specific eGFP-rpl10a expression in the line Tg[vsx2.2:TRAP] tested in TRAP-seq experiments at 22 hpf. L, lens. Scale bar = 100 µm. (F): Differential expression (RPKM) of retinal TF-encoding genes in affinity-purified transcripts from vsx2.2:TRAP embryos at 22 hpf (TRAP-seq, n = 3, green), and in 22 hpf whole embryos RNA-seq sample (control, blue). Note the significant expression enrichment of neural retina-associated transcription factors (ranked by fold-change) in the vsx2.2:TRAP sample (p = 0.0004; two-tailed paired t-test). RPKM values corresponding to TFs from the core retinal GRN, as well as their fold change vs the control, are indicated.

eGFP-rpl10a expression patterns: (A,A′): TT1, hindbrain and spinal chord (lateral and dorsal, respectively); (B,B′): TT5, jaw, brachial arches and pectoral fin buds (lateral and ventral, respectively); (C): TT6, skeletal muscles (lateral); (D): TT7, central nervous system (lateral); (E): TT15, lateral line system (lateral); (F, F′): TT21, rhombomere 5 (lateral and dorsal, respectively); (G,G′): TT28, hindbrain and pectoral fin buds (lateral and dorsal, respectively); (H,H′): TT37, retina (lateral and ventral, respectively); (I,I′): TT42, midbrain stripe (lateral and dorsal, respectively); (J): TT50, spinal cord and pronephros (lateral). ba, branchial arches; cns, central nervous system; dpn, distal pronephros; e, eye; hb, hindbrain; l, lens; llp, lateral line primordium; mbs, midbrain stripe; nr, neural retina; ov, otic vesicle; pfb, pectoral fin buds; rb5, rhombomere 5; sc, spinal cord, sm, skeletal muscles; y, yolk. Scale bar, 100 µm.

Compatibility of TRAP technology with the Gal4/UAS system:(A): Zebrafish embryo from the control cross Tg[Rx3:Gal4] x Tg[UAS:RFP] showing RFP expression in the developing retina (arrow) at 24 hpf. (B): zebrafish embryo derived from a Tg[Rx3:Gal4] × Tg[UAS:TRAP] cross showing eGFP-rpl10a expression at 24 hpf in the retina (arrow). l, lens; y, yolk. Scale bar = 100 µm.

Acknowledgments
This image is the copyrighted work of the attributed author or publisher, and ZFIN has permission only to display this image to its users. Additional permissions should be obtained from the applicable author or publisher of the image. Full text @ Front Cell Dev Biol