
- Title
-
Metal transporter Slc30a1 controls pharyngeal neural crest differentiation via the zinc-Snai2-Jag1 cascade
- Authors
- Xia, Z., Bi, X., Yang, S., Yang, X., Song, Z., Wei, J., Xu, P., Rink, L., Min, J., Wang, F.
- Source
- Full text @ MedComm (Beijing)

Generation and characterization of slc30a1a/slc30a1b double‐knockout zebrafish. (A) Strategy used to perform comparative genomic mining for neural crest (NC)‐related studies using human, mouse, and zebrafish data, resulting in five overlapping studies. (B) Two of the five studies identified in (A) were selected based on in vivo experiments and data involving multiple time points, revealing a total of 38 overlapping genes in these two databases. These genes were then ranked based on their expression levels. (C) Embryonic phenotype mining revealed 12 candidate genes. Nine of these genes have been characterized in vivo, while the other three genes have not been characterized at the functional level. The six genes in green are known to play a role in NC development (mycn, mthfd1l, sox10, polr1b, and mecom) and/or pharyngeal arch (PA) patterning (sox10 and prrx1b). (D) Real‐time quantitative polymerase chain reaction (RT‐qPCR) analysis of the indicated genes at 18–22 hpf. (E) in situ hybridization of wild‐type zebrafish embryos using antisense slc30a1a and slc30a1b probes. The white dashed outlines indicate the pharyngeal region, and the gut is indicated with an orange arrow in the 4 dpf images. (F) Real‐time qPCR analysis of slc30a1a and slc30a1b mRNA in sox10 + and sox10− cells (n = 3 sets of 3 × 10⁴ cells/group). ***p < 0.001. (G) Representative images of slc30a1a/slc30a1b double‐knockout mutants and control embryos. The red arrows in the mutant embryos indicate a smaller head and loss of the lower jaw. (H–K) Representative images of head cartilage in control and mutant zebrafish embryos stained with Alcian blue (H and J) and the corresponding diagrams (I and K). Residual palatoquadrate cartilage in the mutant embryos is indicated with red arrows. Abbreviations for cartilage: M, Meckel's; Pq, palatoquadrate; Bh, basihyal; Ch, ceratohyal; Hs, hyosymplectic; Bb, basibranchial; Cb, ceratobranchial; Hb, hypobranchial; Ih, interhyal |

Pharyngeal arch development is impaired in slc30a1a/slc30a1b double‐knockout embryos. (A–H) The expression pattern of the indicated genes was determined in control and mutant embryos using whole‐mount in situ hybridization. Shown are dorsal views from anterior to the top (A and B) and lateral views from anterior to the left (C–H). The dashed white regions indicate the location of neural crest (NC) progenitors (A–D) and pharyngeal archs (PAs) (E–H). (I–K) Pharyngeal cartilage in control and mutant Tg(fli1a:eGFP) embryos at the indicated ages. (L) Col2 immunostaining (red) showing chondrocyte precursors in the PA of control and mutant Tg(fli1a:eGFP) embryos |

Summary of cell death and cell proliferation in the PA of control and slc30a1a/slc30a1b double‐knockout mutant embryos. (A–C) PH3 immunostaining (red) was performed in order to detect cell proliferation in the pharyngeal arch (PA) of control and mutant Tg(fli1a:eGFP) embryos at the indicated ages. (D) Summary of PH3‐positive cells in the PA of control and mutant embryos at the indicated ages; n.s., not significant. (E) Summary of PH3‐positive cells in the ventral region of PA1 and PA2 in control and mutant embryos at 2 dpf. *p < 0.05. (F and G) A TUNEL assay (red) was used to detect apoptotic cells in the PA area of control and mutant Tg(fli1a:eGFP) embryos at the indicated ages. (H) Summary of TUNEL‐positive cells in the PA area of control and mutant embryos at the indicated ages. (I and J) Schematic drawing depicting PA development in control (I) and mutant (J) embryos. Chondrocytes that differentiate from progenitor cells around 2.5 dpf in controls are shown in blue; in embryos, these cells fail to differentiate and do not survive beyond 2.5 dpf |

SMART‐seq data analysis of neural crest development and zinc concentration. (A) Summary of significantly enriched pathways (p < 0.05) enriched Gene Ontology (GO) terms in control embryos at 2.5 dpf versus control embryos at 2 dpf. In panels A–D, black and red bars indicate p < 0.05 and p < 0.005, respectively. (B) Summary of the most highly enriched GO terms in mutant embryos at 2.5 dpf versus mutant embryos at 2 dpf. (C and D) Summary of significantly enriched GO terms in mutant embryos versus control embryos at 2 dpf (C) and 2.5 dpf (D). (E and F) Heatmaps showing the expression of the indicated marker genes in control and mutant embryos at 2 dpf (E) and 2.5 dpf (F) |
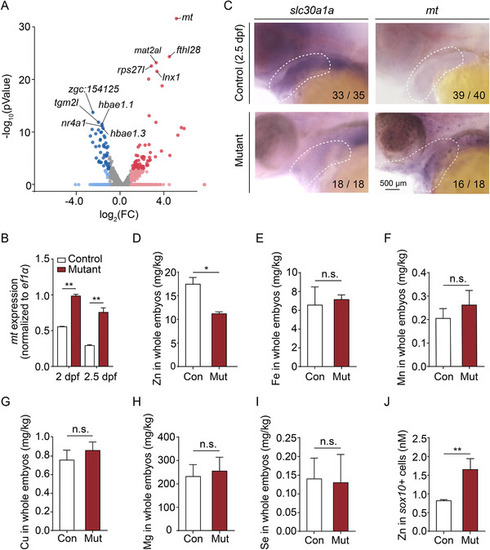
Zinc levels are increased in the pharyngeal arch (PA) of mutant embryos. (A) Volcano plot showing the relative expression of metal ion‐binding genes from Gene Ontology (GO):0046872. Blue and red dots indicate significantly (p < 0.05) downregulated and upregulated genes, respectively, and the mt gene is indicated. Gray dots indicate genes that were neither upregulated nor downregulated (p > 0.05). (B) Summary of mt mRNA measured in sox10 + cells obtained from control and mutant embryos at 2 dpf and 2.5 dpf. (C) Whole‐mount in situ hybridization of the indicated genes in control and mutant embryos at 2.5 dpf. (D–I) Summary of Zn (D), Fe (E), Mn (F), Cu (G), Mg (H), and Se (I) concentration measured in control and mutant embryos using inductively coupled plasma mass spectrometry (ICP‐MS) (n = 2 sets of 100 embryos/group). (J) Summary of Zn concentration measured in sox10 + cells isolated from control and mutant embryos at 2 dpf using a fluorescent zinc indicator (n = 3 sets of 30,000 cells/group). *p < 0.05, **p < 0.01, n.s., not significant |

The upregulated Jagged‐Notch signaling inhibits PA development in mutants. (A and B) The domain‐specific difference in gene expression in mutants relative to controls measured along the dorsal/ventral (DV) axis at 2 dpf (A) and 2.5 dpf (B). D, dorsal; I, intermediate; VI, ventral‐intermediate; V, ventral. **p < 0.01 and ***p < 0.001. (C and D) Volcano plots summarizing the difference in expression of marker genes in mutants relative to controls measured along with the anterior/posterior (AP) and DV axes at 2 dpf (C) and 2.5 dpf (D). Blue and red dots indicate significantly (p < 0.05) downregulated and upregulated genes, respectively. Gray dots indicate genes that were neither upregulated nor downregulated (p > 0.05). The dlx4a, jag1b, and nkx3.2 genes are indicated. (E–G) Whole‐mount in situ hybridization of jag1b in control and mutant embryos at 2 and 2.5 dpf (E), and summary of the staining area at 2 dpf (F) and 2.5 dpf (G), normalized to the respective controls. (H and I) Summary of jag1b and hey1 mRNA measured in sox10 + cells isolated from control and mutant embryos at 2 dpf (H) and 2.5 dpf (I). (J and K) Representative images of head cartilage staining in control and mutant embryos (J) and embryos injected with the jag1b MO (K) or a set of four CRISPR/Cas9 ribonucleoprotein complexes (K’). Examples of two distinct mutant phenotypes, with the corresponding frequencies, are shown in K and K’. The arrows in K and K’ indicate the characteristic “kink” in the control embryos. (L) Summary of hey1 mRNA measured in sox10 + cells isolated from control embryos and control embryos injected with the jag1b MO. (M) Summary of jag1b mRNA measured in control embryos and control embryos injected with the jag1b CRISPR/Cas9 ribonucleoprotein complexes. (N) Violin plot summarizing the number of PA pairs/embryos in control embryos, mutant embryos, and mutant embryos injected with either the jag1b MO or the jag1b CRISPR/Cas9 ribonucleoprotein complexes |

Snai2 is the upstream regulator of jag1b. (A) Venn diagram summarizing the overlap among genes determined by cross‐referencing the Transcriptional Regulatory Relationships Unraveled by Sentence‐based Text‐mining (TRRUST) database, SIGnaling Network Open Resource (SIGNOR) database, and stemness markers analyzed using SMART‐seq. (B) Summary of snai2 mRNA measured in sox10 + cells isolated from control embryos and control embryos exposed to 1 mM zinc. (C) Summary of snai2 mRNA measured in sox10 ‒ and sox10 + cells isolated from Tg(sox10:kikGR) embryos. (D) in situ hybridization of snai2 in control and mutant embryos at 2 and 2.5 dpf. (E and F) Summary of snai2 mRNA measured in sox10 + cells isolated from control and mutant embryos at 2 dpf (E) and 2.5 dpf (F). (G) Summary of snai2 mRNA and jag1b mRNA measured in wild‐type embryos and wild‐type embryos injected with two different sets of snai2 CRISPR/Cas9 ribonucleoprotein complexes. (H–K) Representative images of cartilage staining of control and mutant embryos. Where indicated, the embryos were injected with the snai2 CRISPR/Cas9 ribonucleoprotein complexes (I and J) or both the snai2 and jag1b CRISPR/Cas9 ribonucleoprotein complexes (K). Examples of two distinct mutant phenotypes, with the corresponding frequencies, are shown in panel (K). (L) Violin plot summarizing the number of PA pairs/embryos in control embryos and mutant embryos injected with the snai2 CRISPR/Cas9 ribonucleoprotein complexes alone or together with the jag1b CRISPR/Cas9 ribonucleoprotein complexes (mixed gRNA). *p < 0.05, **p < 0.01, and ***p < 0.001 |
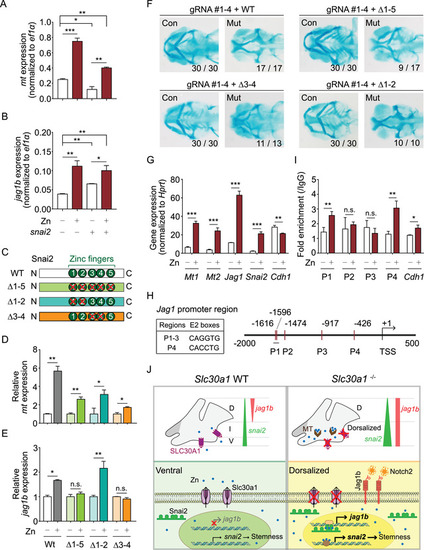
snai2 regulates jag1b expression via its double zinc‐finger domain. (A and B) Summary of mt mRNA(A) and jag1b mRNA (B) measured in sox10 + cells isolated from control embryos treated with zinc and/or injected with snai2 mRNA. (C) Schematic diagram depicting the wild‐type (WT) Snai2 protein and three mutant Snai2 constructs lacking the indicated zinc‐finger (ZF) domains. (D and E) Summary of mt mRNA (D) and jag1b mRNA (E) measured in sox10 + cells isolated from control embryos co‐injected with snai2 CRISPR/Cas9 ribonucleoprotein complexes together with either WT snai2 mRNA or the indicated mutant snai2 mRNAs; where indicated, the embryos were treated 1 mM zinc. (F) Representative images of cartilage staining in the heads of control and mutant embryos co‐injected with snai2 CRISPR/Cas9 ribonucleoprotein complexes together with either WT snai2 mRNA or the indicated mutant snai2 mRNAs. (G) Summary of Mt1, Mt2, Snai2, Jag1, and Cdh1 mRNA measured in mouse primary mesenchymal stem cells (MSCs) cultured in the absence or presence of 10 μM zinc. (H) Schematic illustration of the Jag1 promoter region, showing the approximate locations and sequences of the five E2 boxes. P1 through P4 indicate the primer pairs used for chromatin immunoprecipitation (ChIP) analysis, and the transcription start site (TSS) is indicated. (I) ChIP assay of mouse primary MSCs using the SNAI2 antibody for pull‐down followed by quantitative polymerase chain reaction (qPCR) using the indicated primer pairs to amplify the Jag1 promotor region. Where indicated, the cells were cultured in the absence or presence of 10 μM zinc. The Cdh1 promoter was used as a positive control. (J) Under normal conditions in wild‐type embryos (top left), slc30a1 is expressed in the ventral region to balance zinc homeostasis, jag1b is expressed in the dorsal region, and snai2 is expressed in the ventral pharyngeal arch (PA) more robustly than in the dorsal PA. Ventral snai2 expression suggests a stemness state in this region (bottom left). In the absence of Slc30a1 proteins (top right), zinc accumulates both as free ions and bound to metallothionein (MT) proteins. The expression of snai2 is increased in the ventral region, thereby expanding the pattern jag1b expression. In neural crest progenitor cells (bottom right), the expression of jag1b is upregulated via the double zinc‐finger in the Snai2 protein in a zinc‐dependent manner. The resulting increase in Jag1b activates downstream Notch signaling, arresting chondrocyte differentiation and resulting in “dorsalized” neural crest progenitor cells. *p < 0.05, **p < 0.005, ***p < 0.001, and n.s., not significant |