
- Title
-
Disturbed retinoid metabolism upon loss of rlbp1a impairs cone function and leads to subretinal lipid deposits and photoreceptor degeneration in the zebrafish retina
- Authors
- Schlegel, D.K., Ramkumar, S., von Lintig, J., Neuhauss, S.C.
- Source
- Full text @ Elife
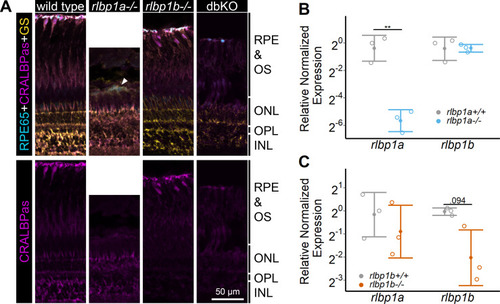
(A) Immunohistochemical staining with cellular retinaldehyde-binding protein (CRALBP) antiserum (CRALBPas, magenta) and RPE65 (cyan) and glutamine synthetase (GS, yellow) as counterstain for RPE and Müller glia, respectively, on cryosections of adult retinas. In rlbp1a−/−, the layer containing RPE and outersegments is reduced in thickness and very disturbed, the white arrow indicates a remaining RPE65-positive cell. Bottom row showing CRALBPas channel, only. (B, C) Relative normalized expression of rlbp1a and rlbp1b in the eyes of the respective single-KO lines. Individual samples are shown with mean ± standard deviation (SD). (B) rlbp1a expression was reduced in rlbp1a−/− eyes [t(4) = 7.39, p = 0.003], while rlbp1b mRNA levels were comparable to wild type [t(4) = −0.06, p = 0.955]. (C) In rlbp1b−/−, rlbp1a expression was similar to wild type [t(4) = 0.849, p = 0.444], but rlbp1b mRNA levels were twofold reduced [t(4) = 2.84, p = 0.094]. Statistics: t-test comparing KO vs. wild type for each target with Benjamini–Hochberg correction for multiple testing. Significance: **p < 0.01. Abbreviations: double-knockout (dbKO), retinal pigment epithelium (RPE), outer segment (OS), outer nuclear layer (ONL), outer plexiform layer (OPL), and inner nuclear layer (INL). See Figure 1—source data 1 for expression data.
|

Retinoid content of adult eyes (A, C, E) or whole larvae (B, D), determined by high-performance liquid chromatography (HPLC) analysis. (A, C, E) Adults: samples were collected in ambient light. For each knockout (KO) line, 11cisRAL, 11cisRE, and atRE levels were determined. Data from n = 3 individual samples per genotype are shown with their respective mean ± standard deviation (SD). (A) rlbp1a-KO line: one-way analysis of variance (ANOVA) revealed a significant effect of genotype on the amount of retinoids for 11cisRAL [F(2,6) = 6.215, p = 0.035], 11cisRE [F(2,6) = 17.328, p = 0.003], and atRE [F(2,6) = 6.526, p = 0.031]. (C) rlbp1b-KO line: genotype had an effect on 11cisRE levels (one-way ANOVA) [F(2,6) = 40.774, p < 0.001], but less so on 11cisRAL [F(2,6) = 3.378, p = 0.104] and atRE [F(2,6) = 3.676, p = 0.091]. (E) double-KO line. 11cisRAL is reduced in dbKO [t(4) = 10.2, p = 0.0005]. The retinyl esters 11cisRE [t(4) = −3.84, p = 0.018] and atRE [t(4) = −2.04, p = 0.112] accumulate (Student’s t-test). (B, D) Larvae: single-KO larvae (n = 3 samples per genotype and condition, where one sample equals 100 larvae per condition and genotype) were collected after exposure to different light conditions (DA: dark-adapted; ambient: ambient light; 30’ BL: 30 min exposure to bleaching light at 20’000 lux; 1 hr BL: 1 hr exposure to 20’000 lux; 1 hr reDA: 1 hr at 20’000 lux after wich the larvae were allowed to redark adapt for 1 hr). Samples were collected in three independent experiments per KO line and data for 11cisRAL, 11cisRE, and atRE levels are shown as mean ± SD and the main effect of genotype on the amount of retinoids was calculated with two-way ANOVA. (B) In rlbp1a−/− larvae11cisRAL levels are reduced [F(1,28) = 85.51, p < 0.001] whereas retinyl esters 11cisRE [F(1,28) = 9.84, p = 0.004] and atRE [F(1,28) = 4.133, p = 0.052] are slightly elevated. (D) 11cisRAL regeneration in rlbp1b−/− larvae is not affected [F(1,16) = 0.003, p = 0.96] and 11cisRE levels are comparable to rlbp1b+/+ larvae [F(1,16) = 2.246, p = 0.153]. The amount of atRE is slightly elevated [F(1,16) = 6.05, p = 0.026]. Pairwise comparisons to the respective control were performed with Benjamini–Hochberg correction for multiple testing. Significance levels are indicated by asterisks. p ≥ 0.05 is not shown. *p < 0.05, **p < 0.01, ***p < 0.001. See Figure 2—source data 1 for retinoid measurements.
|
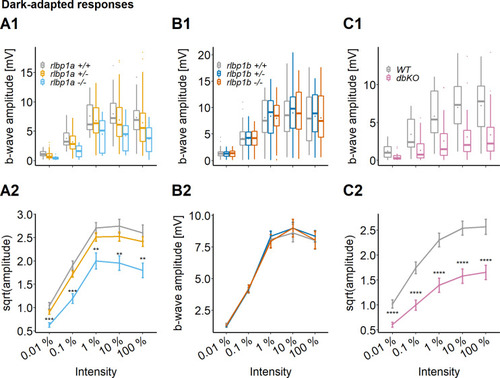
ERG responses at 5 days postfertilization (dpf). Responses were probed in the different knockout (KO) lines at five increasing light intensities under dark-adapted conditions. (A1–C1) Data are shown as boxplots of the b-wave amplitude with the box depicting the interquartile range (IQR), whiskers are 1.5 × IQR, mean is shown as diamond, median as horizontal line in the box and outliers are points outside of 1.5 × IQR. Data were collected in N ≥ 3 independent experiments and from total n ≥ 18 larvae per genotype (A: rlbp1a-KO line) or n ≥ 43 larvae per genotype (B: rlbp1b-KO line) or n ≥ 29 larvae per genotype (C: double-KO line). (A2–C2) Data are shown as mean ± standard error of the mean (SEM). (A) Respones of the rlbp1a-KO line. (A2) Repeated-measures analysis of variance (ANOVA) revealed a significant effect for genotype [F(2,435) = 33.649, p < 0.001]. (B) Respones of the rlbp1b-KO line. (B2) Repeated-measures ANOVA did not reveal any significant effect of genotype on amplitude [F(2,915) = 0.185, p = 0.83]. (C) Responses of double-KO and wild types. (C2) Repeated-measures ANOVA revealed a significant effect for genotype [F(1,290) = 99.808, p < 0.001]. Statistical analysis was performed on data in (A2, C2) after square root transformation to mitigate the impact of outliers. Pairwise comparisons between wild type (WT) and mutants at each light intensity were computed and corrected for multiple testing using the Benjamini–Hochberg correction. Significance levels of pairwise comparisons depicted as asterisks: **p < 0.01, ***p < 0.001, ****p < 0.0001. See Figure 3—source data 1 for b-wave amplitudes.
|

Photopic and redark-adapted electroretinogram (ERG) responses at 5 days postfertilization (dpf). (A1, B1) Data are shown as boxplots of the b-wave amplitude with the box depicting the interquartile range (IQR), whiskers are 1.5 × IQR, mean is shown as diamond, median as horizontal line in the box and outliers are points outside of 1.5 × IQR. Responses were probed at five increasing light intensities and under different background illumination. LA: light-adapted, no dark adaptation before measurements and background illumination during recordings. BL: recordings immediately after 1 hr exposure to bleaching light at 20’000 lux. reDA: recordings after bleaching and 1 hr redark adaptation. Dotted lines depict the mean responses of wild-type controls after dark adaptation at 0.01 % light intensity to illustrate the shift in sensitivity under photopic conditions. Data were collected in N ≥ 3 independent experiments and from total n = 15 larvae per genotype and light condition (A: rlbp1a-knockout [KO] line), or n ≥ 20 larvae per genotype and light condition (B: double-KO line). (A2, B2) Data are shown as mean ± standard error of the mean (SEM). (A2) Left panel: light-adapted responses of rlbp1a−/− vs. rlbp1a+/+. Repeated-measures analysis of variance (ANOVA) revealed a significant effect for genotype on b-wave amplitude [F(1,112) = 13.476, p < 0.001]. Middle panel: responses after a bleach. Effect of genotype: [F(1,84) = 47.908, p < 0.001]. Right panel: responses after bleach and redark adaptation. Effect of genotype: [F(1,112) = 81.267, p < 0.001]. (B2) Left panel: light-adapted responses of dbKO vs. wild type (WT). Effect of genotype: [F(1,236) = 32.633, p < 0.001]. Middle panel: responses after a bleach. Effect of genotype: [F(1,172) = 125.858, p < 0.001]. Right panel: responses after bleach and redark adaptation. Effect of genotype: [F(1,168) = 106.625, p < 0.001]. Statistical analysis was performed on data in (A2, B2) after square root transformation to mitigate the impact of outliers. Only intensity levels where wild-type values were above the dark-adapted threshold were considered in the analysis. Pairwise comparisons between WT and mutants at each light intensity were computed and corrected for multiple testing using the Benjamini–Hochberg correction. Significance levels of pairwise comparisons depicted as asterisks: *p < 0.05, ***p < 0.001, ****p < 0.0001. See Figure 4—source data 1for b-wave amplitudes.
|

(A1–F1) Central retinal semithin plastic sections (dorsal and ventral of the optic nerve) of rlbp1a+/+ and rlbp1a−/− 5 dpf larvae (A, B), 1-month-old juveniles (C, D), and adults (E, F). (A2–F2) Closeup of area in red box. Subretinal lipid deposits in rlbp1a−/− retinas are found already at 5 days postfertilization (dpf) and increase in number and size with age. Occasionally, these structures are found in wild-type controls, but are usually smaller in size. Black arrows: rod outer segments. Red star: subretinal lipid deposits. Red arrow: missing cone outer segment. (A3, B3) Ventral peripheral retina. Black arrows indicate rod outer segments. These are less abundant, but not completely absent in KO retinas. (G) Quantification of outer nuclear layer (ONL) thickness central retinal sections in 5 dpf (G1), 1-month-old (G2), and adult (G3) retinas. Data are from n ≥ 3 biological replicates per genotype and age. Shown is the mean ± standard deviation (SD) at specified distances from the optic nerve (dorsal and ventral). Effect of genotype on ONL thickness (repeated-measures analysis of variance [ANOVA]) at 5 dpf (G1) [F(1,16) = 0.029, p = 0.87], at 1 month (G2) [F(1,4) = 144.518, p < 0.001], and in adults (G3) [F(1,4) = 18.642, p = 0.012]. Pairwise comparisons of rlbp1a−/− vs. rlbp1a+/+ by region were calculated with Benjamini–Hochberg correction for multiple comparisons. (H) Quantification of the number of lipid droplets in 5 dpf (H1), 1-month-old (H2), and adult (H3) retinas. Comparison of rlbp1a−/− vs. rlbp1a+/+ was performed using t-test: (H1) [t(10.5) = −4.61, p < 0.001], (H2) [t(4.87) = −43.2, p < 0.001], and (H3) [t(2.21) = −3.83, p = 0.0525]. Individual data points (open circles) from n ≥ 3 biological replicates per genotype and age are shown with mean ± SD. (I) Staining for neutral lipids with BODIPY TR methyl ester confirms disturbed outer segment morphology and accumulation of lipid droplets in the subretinal space of rlbp1a−/− retina. The example shows adult retinas of the respective genotype. Significance levels depicted as asterisks: *p < 0.05, **p < 0.01, ***p < 0.001, ****p < 0.0001. Scale bars: (A1, A3, B1, B3) 20 μm, (A2, B2) 10 μm, (C1–F1) 50 μm, (C2–F2) 25 μm, and (I) 10 μm. See Figure 5—source data 1 for measurements in G and H.
|

Relative normalized expression of rhodopsin in the eyes of the respective knockout (KO) lines. Rhodopsin mRNA levels in the rlbp1a-KO line are reduced at (A) 5 days postfertilization (dpf) [t(3.13) = 2.95, p = 0.057] and (B) in adults [t(4) = 6.43, p = 0.003]. (C) Similar to the rlbp1a-KO, rhodopsin mRNA levels are reduced in double-KO at 5 dpf [t(2.93) = 5.22, p = 0.015] and (D) adults [t(3.99) = 9.35, p < 0.001]. Individual samples (open circles) are shown with mean ± standard deviation (SD). Statistics: t-test comparing double-KO vs. wild type. *p < 0.05, **p < 0.01, ***p < .001. See Figure 6—source data 1 for expression data.
|

(A1–F1) Central retinal semithin plastic sections (dorsal and ventral of the optic nerve) of wild type (WT) and double-KO 5 days postfertilization (dpf) larvae (A, B), 1-month-old juveniles (C, D), and adults (E, F). (A2–F2) Closeup of area in red box. Subretinal lipid deposits in double-KO retinas are found already at 5 dpf and increase in number with age. Occasionally, these structures are found in wild-type controls. Black arrows: rod outer segments. Red star: subretinal lipid deposits. (A3, B3) Ventral peripheral retina. Black arrows indicate rod outer segments. These are less abundant, but not completely absent in double-KO retinas. (G) Quantification of outer nuclear layer (ONL) thickness in 5 dpf (G1), 1-month-old (G2), and adult (G3) retinas. Data are from n ≥ 3 biological replicates per genotype and age. Shown is the mean ± SD at specified distances from the optic nerve in central retinal sections (dorsal and ventral). Effect of genotype on ONL thickness (repeated-measures analysis of variance [ANOVA]) at 5 dpf (G1) [F(1,7) = 3.701, p = 0.096], at 1 month (G2) [F(1,4) = 4.459, p = 0.102], and in adults (G3) [F(1,6) = 44.074, p < 0.001]. Pairwise comparisons of dbKO vs. WT by region were calculated with Benjamini–Hochberg correction for multiple comparisons. (H) Quantification of the number of lipid droplets throughout a central retinal section in 5 dpf (H1), 1-month-old (H2), and adult (H3) retinas. Comparison of double-KO vs. wild type was performed using t-test: (H1) [t(6.94) = −6.72, p < 0.001], (H2) [t(2.08) = −7.65, p = 0.015], and (H3) [t(3.25) = −5.39, p = 0.0102]. Individual data points (open circles) from n ≥ 3 biological replicates per genotype and age are shown with mean ± standard deviation (SD). (I) Staining for neutral lipids with BODIPY TR methyl ester confirms accumulation of lipid droplets in the subretinal space of the double-KO retina. The example shows adult retinas of the respective genotype. Significance levels depicted as asterisks: *p < 0.05, **p < 0.01, ***p < 0.001. Scale bars: (A1, A3, B1, B3) 20 μm, (A2, B2) 10 μm, (C1–F1) 50 μm, (C2–F2) 25 μm, and (I) 10 μm. See Figure 7—source data 1 for measurements in G and H.
|
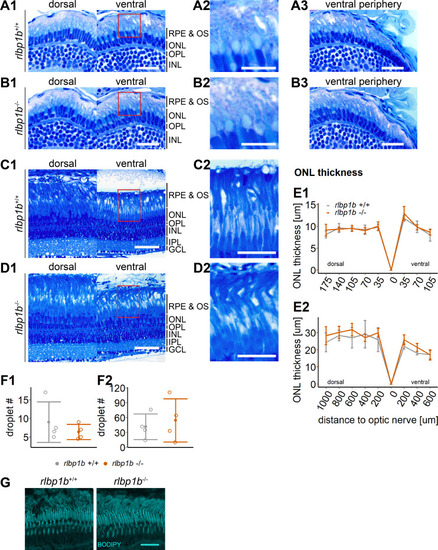
(A1–D1) Central retinal semithin plastic sections (dorsal and ventral of the optic nerve) of rlbp1b+/+ and rlbp1b−/− 5 days postfertilization (dpf) larvae (A, B), and adults (C, D). (A2–D2) Closeup of area in red box. (A3, B3) Ventral peripheral retina. (E) Quantification of outer nuclear layer (ONL) thickness in 5 dpf (E1) and adult (E2) retinas. Data are from n ≥ 3 biological replicates per genotype and age. Shown is the mean ± standard deviation (SD) at specified distances from the optic nerve in central retinal sections (dorsal and ventral). Effect of genotype on ONL thickness (repeated-measures analysis of variance [ANOVA]) at 5 dpf (E1) [F(1,8) = 0.881, p = 0.38] and in adults (E2) [F(1,6) = 1.278, p = 0.30]. (F) Quantification of the number of lipid droplets throughout a central retinal section in 5 dpf (F1) and adult (F2) retinas. Comparison of rlbp1b−/− vs. rlbp1b+/+ was performed using t-test: (F1) [t(3.84) = 0.904, p = 0.42] and (F2) [t(4.86) = −0.503, p = 0.64]. Individual data points (open circles) from n ≥ 3 biological replicates are shown per genotype and age with mean ± standard deviation (SD). (G) Staining for neutral lipids with BODIPY TR methyl ester reveals a healthy adult retina in both rlbp1b+/+ and rlbp1b−/−. Scale bars: (A1, A3, B1, B3) 20 μm, (A2, B2) 10 μm, (C1, D1) 50 μm, (C2, D2) 25 μm, and (G) 10 μm. See Figure 8—source data 1 for measurements in E and F.
|

Retinoid metabolism in healthy and Cralbpa-deficient retinas. Illustration of a healthy (leftmost) and Cralbpa-deficient (rightmost) retina with the three neural layers (nuclei in dark blue). Rod and cone photoreceptors are depicted with dark blue or turquoise outer segments, respectively. Both retinal pigment epithelial (RPE) cells (gray-brown) and Müller glia (yellow-brown) contact photoreceptors and are potential sources for chromophore. Between the illustrations, schematics for retinoid metabolism in healthy and Cralbpa-deficient retinas are shown with black arrows indicating the sequence of reactions or transport/diffusion (for simplicity, enzymes or transport proteins other than Cralbp are not shown). In healthy retinas, Cralbpa facilitates the generation of 11cisRAL from both atRE (via the canonical visual cycle) and 11cisRE (through light-dependent hydrolysis, yellow arrow). Therefore, lack of RPE-expressed Cralbpa leads to a reduction of 11cisRAL (gray, dotted arrows) and an accumulation of retinyl ester (bold, black arrow), which manifests as an increased number of enlarged retinosomes in RPE cells (yellow circles in schematic and illustration on the right). Both rod and cone outer segment morphology is affected and with age the outer nuclear layer is thinning and the RPE may become atrophic. The contribution of Müller glial cell-expressed Cralbpb to chromophore regeneration is smaller than expected and the enzymes involved as well as the retinoid species supplied to photoreceptors (11cisRAL/11cisROL?) remain to be further investigated. |