
- Title
-
N-Heterocyclic Carbene Iron Complexes as Anticancer Agents: In Vitro and In Vivo Biological Studies
- Authors
- Lenis-Rojas, O.A., Cordeiro, S., Horta-Meireles, M., Fernández, J.A.A., Fernández Vila, S., Rubiolo, J.A., Cabezas-Sainz, P., Sanchez, L., Fernandes, A.R., Royo, B.
- Source
- Full text @ Molecules

Figure 1. Molecular structure of the Fe–NHC complexes tested in this work. |
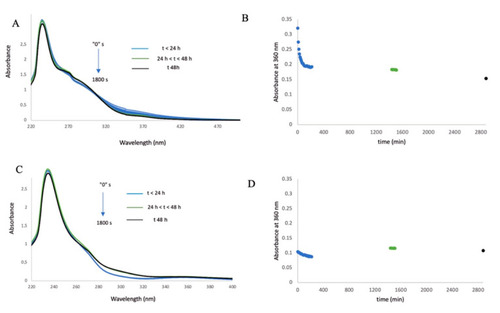
Figure 2. Time evolution of the UV–vis absorption spectrum of Fe1 (A) and Fe2 (C) in PBS buffer at pH 7 at room temperature under aerobic conditions. Variation of the absorbance, measured at 360 nm of Fe1 (B) and Fe2 (D). Blue colour indicates measurements made at t < 24 h, green colour indicates measurements at 24 h < t < 48 h, and black colour indicates measurements at t 48 h.
|

Figure 3. Cell viability (%) of A2780 (A) and HCT116 (B) tumour cell lines after 48 h of exposure to Fe1 and Fe2 complexes. Cell viability was determined using the MTS assay. Data expressed as mean ± SEM. * p < 0.05.
|
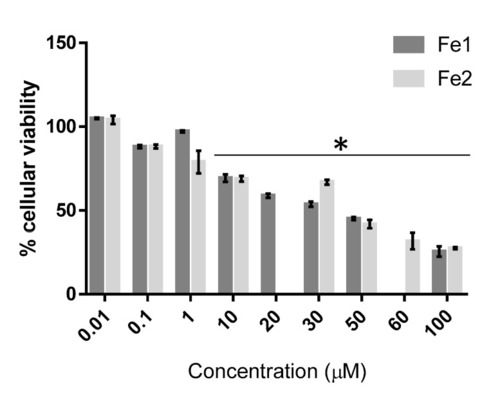
Figure 4. Cell viability (%) after 48 h of exposure of fibroblasts to the Fe1 and Fe2 complexes. Cell viability was determined using the MTS assay. Data expressed as mean ± SEM. * p < 0.05.
|
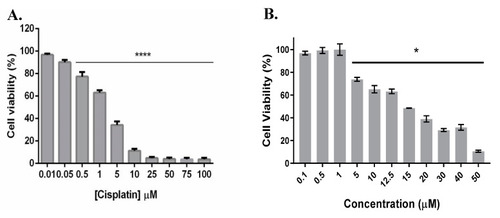
Figure 5. Cytotoxicity of cisplatin in A2780 (A) and HCT116 (B) cell lines after 48 h of incubation (1.9 ± 0.2 µM and 15.6 ± 5.3 µM for A2780 and HCT116 cell lines, respectively). Cell viability was determined using the MTS assay. Data normalised against the control (0.1% (v/v) DMSO) and expressed as the mean ± SEM of three independent assays. * p < 0.05; **** p < 0.005.
|

Figure 6. Accumulative mortality over (72 h) for complex Fe1 (A) and complex Fe2 (B) at the different stages evaluated (in hpf).
|

Figure 7. Mortality–response curve for Fe1 (A) and Fe2 (B).
|

Figure 8. In vivo effectivity assays of Fe1 and Fe2 against human HCT116 colorectal cancer cell line: (A) Representative images of the caudal hematopoietic tissue (CHT) in the tail region of the zebrafish embryos where cells metastasize and proliferate at 3 dpi. Main images are a superposition of a fluorescence image and a bright field image of the same embryo. Fluorescence images show only the labelled cells of the main image. Scale = 250 µm; (B) fold change comparing 3 dpi against 1 dpi and normalised to the control condition at 3 dpi. The red line state the cell maintenance, above the bar, proliferation occurs, and below the bar, the cells decrease, compared to the control condition (n = 6 embryos/condition).
|