
- Title
-
A Reliable High-Throughput Screening Model for Antidepressant
- Authors
- Zhang, R., Qiao, C., Liu, Q., He, J., Lai, Y., Shang, J., Zhong, H.
- Source
- Full text @ Int. J. Mol. Sci.
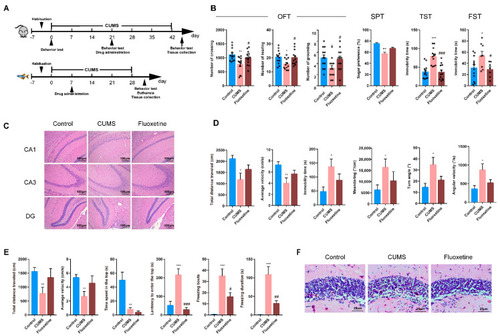
Experimental design and effect of CUMS on mice and zebrafish. (A) Experimental design for CUMS. (B) The results of behavioral tests for OPT, SPT, FST and TST of CUMS mice. The round symbols indicate data distribution. (C) Histopathological observation on mice hippocampus, 100×. (D,E) The results of behavioral tests for OFT and NTT of CUMS zebrafish. (F) Histopathological observations on adult zebrafish brain, 200×. Data are represented as mean ± SEM. * p < 0.05, ** p < 0.01, *** p < 0.001, compared with control; # p < 0.05, ## p < 0.01, ### p < 0.001, compared with CUMS. |

Experimental design and effect of reserpine on mice and zebrafish. (A) Experimental design for reserpine. (B) The results of behavioral tests for OPT, SPT, FST and TST of reserpine in mice. The round symbols indicate data distribution. (C) Histopathological observation of mice hippocampus, 200×. (D,E) The results of behavioral tests for OFT and NTT of reserpine in zebrafish. (F) Histopathological observations on adult zebrafish brain, 200×. Data are represented as mean ± SEM. * p < 0.05, ** p < 0.01, *** p < 0.001, compared with control; # p < 0.05, ## p < 0.01, ### p < 0.001, compared with CUMS reserpine group. |

The PCA and OPLS-DA score plots of each model. (A) The PCA score plot of CUMS in mice. (B) The PCA score plot of CUMS in zebrafish. (C) The OPLS-DA score plot of CUMS in mice. (D) The OPLS-DA score plot of CUMS in zebrafish. (E) The PCA score plot of reserpine in mice. (F) The PCA score plot of reserpine in zebrafish. (G) The OPLS-DA score plot of reserpine in mice. (H) The OPLS-DA score plot of reserpine in zebrafish. Blue represents Control group, red represents model group. |

The heatmap and Venn diagram of each model. (A) The heatmap of CUMS in mice. (B) The heatmap of CUMS in zebrafish. (C) The heatmap of reserpine in mice. (D) The heatmap of reserpine in zebrafish. (E) Venn diagram of differential metabolites that were in common with or unique to the CUMS models in mice and zebrafish. (F) Venn diagram of differential metabolites that were in common with or unique to the reserpine models in mice and zebrafish. In (A–D), Blue represents Control group, red represents model group. |

Metabolic analysis results of the four depression models. (A), the structure types of the metabolites. (B), the pathways of the metabolites. |