
- Title
-
Two-Photon Laser Ablation and In Vivo Wide-Field Imaging of Inferior Olive Neurons Revealed the Recovery of Olivocerebellar Circuits in Zebrafish
- Authors
- Hiyoshi, K., Saito, K., Fukuda, N., Matsuzaki, T., Yoshikawa, H.Y., Tsuda, S.
- Source
- Full text @ Int. J. Environ. Res. Public Health
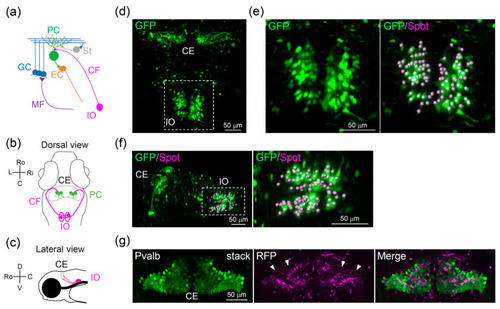
Cerebellar circuits in zebrafish: (a) Schematic diagram of the cerebellar circuits in zebrafish. (b,c) Schematic diagram of the olivocerebellar circuits: (b) Dorsal view and (c) lateral view. (d–f) Distribution of inferior olive neurons in Tg(hspGFFDMC28C;UAS:GFP) zebrafish at 7 days post-fertilization (dpf): (d,e) Dorsal view, with a high-magnification image shown in (e), where spots indicate the position of the soma of inferior olive neurons. (f) Dorsolateral view, with a high-magnification image of the inferior olive shown in the right panel. (g) Dorsal view of the cerebellum of Tg(hspGFFDMC28C;UAS:RFP) larva stained with Parvalbumin 7 (Pvalb) at 6 dpf (confocal z-stack images). Arrowheads indicate CFs. CE, cerebellum; CF, climbing fiber; EC, eurydendroid cell; GC, granule cell; IO, inferior olive; MF, mossy fiber; PC, Purkinje cell; St, stellate cell; Ro, rostral; C, cordal; L, left; Ri, right; D, dorsal; V, ventral. |

Two-photon laser ablation of the inferior olive in zebrafish: (a) Schematic diagram of the laser ablation system. (b) Right hemisphere of the inferior olive was irradiated. CE, cerebellum; CF, climbing fiber; IO, inferior olive; OT, optic tectum. (c–e) Images of the inferior olive neurons before (left) and shortly after (right) laser irradiation. Red circles indicate the target area of irradiation. The arrowheads in the magnified images in (d) indicate neurons that showed abnormal morphology after laser irradiation (d, right). |

Changes in the inferior olive neurons after two-photon laser ablation: (a) Schematic diagram of the zebrafish inferior olive and cerebellum. CE: cerebellum, CF: climbing fiber, IO: inferior olive; (b) Dorsal view of the inferior olive (confocal z-stack images). The red dashed lines indicate the ablated region (the right hemisphere of the inferior olive). Before ablation: ⅰ, after ablation: ⅱ (9 h), iii (1 day), iv (2 days), and v (5 days). |
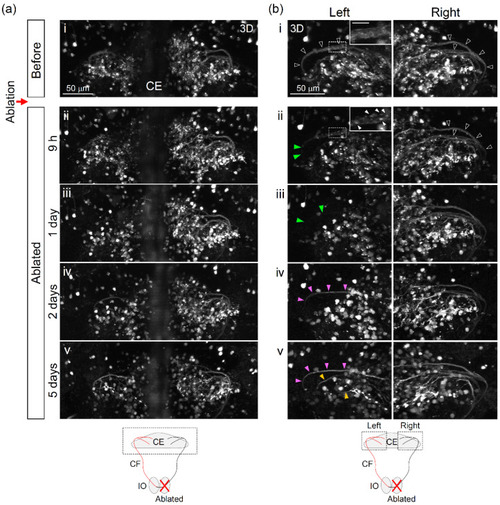
Structural changes of climbing fibers (CFs) in the cerebellar region induced by the two-photon laser ablation of the inferior olive. (a,b) Three-dimensional dorsal view of climbing fibers. The area of observations is shown by the dotted line in the schematic diagram. Before ablation: i, after ablation: ii (9 h), iii (1 day), iv (2 days), and v (5 days). (b) A similar region as (a), but the orientation is slightly different: A high-magnification image is inserted in the upper right corner in (b-i) (before) and (b-ii) (after 9 h). Scale bar: 10 μm. Black arrowheads in (b-i) indicate the bundle of CFs. Green arrowheads in (b-ii,iii) indicate the defected CFs after laser ablation. Red and yellow arrowheads (b-iv,v) indicate newly emerged CFs. |