FIGURE SUMMARY
Title

Medium-throughput zebrafish optogenetic platform identifies deficits in subsequent neural activity following brief early exposure to cannabidiol and Δ9-tetrahydrocannabinol

Authors
Kanyo, R., Amin, M.R., Locskai, L.F., Bouvier, D.D., Olthuis, A.M., Allison, W.T., Ali, D.W.
Source
Full text @ Sci. Rep.

High-throughput quantification of neural activity in freely-swimming zebrafish larvae. (a) CaMPARI photoconverts from green to red fluorescing versions in the neuron only in the presence of both high intracellular calcium concentrations and a bright 405 nm light source. (b) Lateral view of green fluorescing CaMPARI merged with brightfield image shows exclusive expression in the CNS due to a pan-neural promoter (elavl3). (c) Larvae were transferred to 48 wells in the centre of a 96-well plate to ensure that the 405 nm LED Flood Array covers all larvae entirely. To minimize overheating, the plate was floating in a waterbath at 10 cm distant to the LED while CaMPARI was photoconverted (PC) by the LED Flood Array. (d) Lateral view of zebrafish with exemplar “CaMPARI Activity” heat maps. Heat maps show ratio of red/green (R/G) fluorescent output as indicated by the calibration bar and can be interpreted as relative neural activity. CNS regions with higher levels of neural activity translate to “hotter” pixels. Images were acquired using an automated INCell 2000 high-content microscope and reveal a reduction in neural activity when the larvae were anesthetized with MS-222 or an increase with convulsants, PTZ and 4-AP. Top, Enlarged lateral view from freely swimming larvae illustrating the optic tectum and hindbrain areas (dashed line) from which the R/G ratio was obtained. (e) Neural activity, inferred from the mean R/G ratio in optic tectum and hindbrain. CaMPARI activity is reduced to baseline in MS222-anaesthetized fish and photoconversion is undetectable when CaMPARI photoconverting light is omitted. Dashed green line represents mean for MS-222-anesthetized samples, which show a clear reduction in signal compared to freely swimming larvae and provides a baseline “near-zero” activity level for reference in subsequent experiments. Drivers of neural activity, PTZ and 4-AP induce a significant increase in CaMPARI activity. (f) Locomotor activity was measured using behavioural tracking software. PC light from the day prior at 4 days post-fertilization (dpf) did not affect locomotion at 5 dpf. MS-222 treatment abolished any swimbouts. Biological replicates are individual larvae = n. **Significantly different from freely swimming samples, p < 0.01.

Early application of CBD and THC reduce subsequent neural activity and locomotor activity. (a) The chemical structures of key cannabinoids used in this study: CBD and THC. (b), Timeline of experimental set up where zebrafish embryos were treated with drugs between 0.5 and 1 h post-fertilization (hpf) and washed out at 10 hpf towards the end of gastrulation. CaMPARI imaging was obtained at 4 days post-fertilization (dpf) and locomotor activity was tracked at 5 dpf. (c) and (f), Representative CaMPARI activity maps obtained from treated larvae and corresponding quantification and statistics shown in (d) and (g), respectively. (e) and (h), Locomotor activity of the same larvae. (c) CBD reduces neural activity and locomotor activity as shown in (d) and (e). (f) THC requires a higher does than CBD to reduce neural activity and locomotor activity as shown in (g) and (h). CaMPARI activity heat maps show ratio of R/G channels as indicated by the calibration bar, with higher ratios (hotter colours) representing greater neural activity. Green-dashed lines depict mean baseline (zero) value for MS-222 anesthetized samples (From Fig. 1). Biological replicates are n = 8–19. *is p < 0.05; **p < 0.01 compared to the vehicle control (0.3% MeOH in experiments with CBD and 0.6% MeOH for THC).

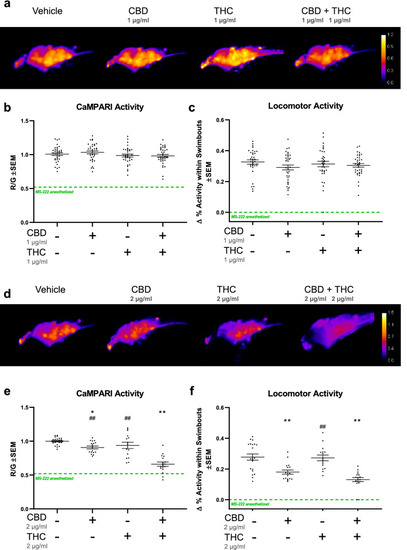
Antagonistic effect of CBD on neural activity is enhanced when combined with sub-effective doses of THC. Zebrafish larvae were exposed to a series of CBD and THC concentrations by themselves or in combination, which are mostly sub-effective, or in the case of CBD, were minimally effective. (a) and (d), Exemplar CaMPARI activity heat maps show an additive effect (minimizing neural activity) when exposed to 2 µg/ml (d) of each CBD and THC compared to CBD or THC by themselves (as plotted in (e)). When 1 µg/ml of 1:1 CBD and THC was applied, ratios show no additive effect as illustrated by quantifications and statistics in (b). (c) and (f), Locomotor activity from the same well at 5 dpf shows a clear reduction when CBD and THC is combined at 2 µg/ml each, but reduction mediated by CBD alone is almost as low as when combined with THC suggesting that CBD is the main component affecting locomotor activity. R/G is indicated by the calibration bar. Green-dashed lines depict mean values for MS-222-anesthetized samples (from Fig. 1). Biological replicates are n = 15–25. *compared to vehicle control (equal amount of MeOH in all experiments); # compared to CBD plus THC. One symbol is p < 0.05; Two symbols is p < 0.01.

Cannabinoid receptor 1 (CB1R) and CB2R are both involved in CBD-mediated reduction of locomotor activity. Zebrafish larvae were exposed to CBD (3 µg/ml) with CB1R- and CB2R inhibitors, AM251 and AM630, respectively. (a) and (b), Exemplar CaMPARI heat maps showing R/G ratios obtained at 4 dpf. (c) and (d), Corresponding quantifications showing CBD mediated-reduction of neural activity is not fully rescued when CB1R is inhibited with AM251 or CB2R with AM630 in the nanomolar (nM) range. (e) and (f), Locomotor activity at 5 dpf shows a clear rescue when inhibiting either CB1R or CB2R with 0.1 nM AM251, or 10 nM AM630, respectively. (g) and (h), shows that applying AM251 or AM630 without CBD did not affect CaMPARI activity or locomotion. R/G is indicated by the calibration bar. All samples contained the same amount of vehicle DMSO (0.1%) and MeOH (0.3%) including the vehicle control (Veh.). Green-dashed lines depict mean values for MS-222 anesthetized samples. Biological replicates are n = 13–30. *is p < 0.05; **p < 0.01 compared to CBD.

Acknowledgments
This image is the copyrighted work of the attributed author or publisher, and ZFIN has permission only to display this image to its users. Additional permissions should be obtained from the applicable author or publisher of the image. Full text @ Sci. Rep.