
- Title
-
Effects of Extended Pharmacological Disruption of Zebrafish Embryonic Heart Biomechanical Environment on Cardiac Function, Morphology and Gene Expression
- Authors
- Foo, Y.Y., Motakis, E., Tiang, Z., Shen, S., Lai, J.K.H., Chan, W.X., Wiputra, H., Chen, N., Chen, C.K., Winkler, C., Foo, R.S.Y., Yap, C.H.
- Source
- Full text @ Dev. Dyn.

(A) All BDM-treated embryos featured pericardial effusion (red arrowheads) and some manifested an upward-curved tail (yellow arrowhead). (B) A 5 dpf treated embryo was positioned below a wild-type (control), showing an array of phenotypic distinctions, including a shorter body length, yolk retention, and pericardial effusion. (C–C′) The cross-sectional area (red dashed line) of the control and BDM-treated ventricles was estimated. (D–D′) The measurement of cardiac looping angle from a control and a BDM-treated heart. A, atrium; V, ventricle. (E) The number of treated embryos which died or survived from 2 to 5 pdf, evaluated for control and for treated embryos at pre- and post-washout. (F) Growth retardation was observed in treated embryos at 5 dpf. (G) The size of the yolk sac among treated embryos was about 40% larger than that of control. (H) Comparison of cardiac looping angle between control and treated group. (I) Relative end-diastolic ventricular size was obtained by normalizing the cross-sectional area to that of control. For -F-I, mean and SDs were presented and two-sample t-test was used, where *P < 0.05
|

(A) Morphology of blebbistatin-treated hearts at 5 dpf. Blebbistatin-treated hearts exhibited a significantly (~27%) smaller end-diastolic ventricular size (A) and an abnormally large cardiac looping angle (B). Mean and SD were presented and two-sample t-test was used, where *P < 0.05
|

(A) The number of zebrafish embryos that survived with no heartbeat or mild contractions was assessed. Number of embryos with mild contraction increased from 36% (16/44) to 51% (21/41), suggesting that the washout partially restores heart contractility. (B) The heart rate (n = 7) dropped by 25% within 30 minutes of treatment at 2 dpf. At 5 dpf, the heart rate of treated hearts before washout (n = 15) was far lower than that of control (n = 20) but washout increased heart rate by 19% (n = 20). Note that the treated embryos with no heartbeats were excluded in this calculation. (C) Ventricular fractional area changes from systole to diastole of control (n = 10) and treated hearts (n = 10), calculated from 2D microscopy, evaluated based on the end-systole which was normalized to the end-diastole at 2, 3, and 5 dpf, respectively. For B-C, mean and standard deviations were presented and a two-sample t-test was used, where *P < 0.05. (D) Fractional shortening, a metric of myocardial contractility, measured from cardiac motion tracking of 3D LSFMM microscopy images, taking the end-diastole state as the zero stretch reference, at 3 and 5 dpf
|

Controls (n = 5) and treated hearts before (n = 5) and after (n = 5) washout were quantified for (A–C) ventricular outlet velocity, (D) heart rate, (E) ejected stroke volume, and (F) ejected cardiac output. For (D–F), mean and standard deviations were presented and a two-sample t-test was used, where *P < 0.05. Note that the heart rate plot (D) differs from Figure 3B as the chosen embryos were specifically assessed for other parameters and the sample size was limited to five |

(A) LSFMM image and spatial WSS contour of 5 dpf treated heart I (pre-washout) during systole and diastole, respectively. A, atrium; V, ventricle. Spatial–temporal WSS assessment of controls at 5 dpf (hearts I, II, and III), and treated hearts at 5 dpf before and after BDM washout. Treated hearts I and II were collected before BDM washout and treated hearts III and IV were analyzed after BDM removal. Area-averaged WSS experienced at the inlet, mid-ventricular, and outlet were measured over a course of cardiac cycle for controls and treated hearts (B–G), respectively. (H) Time-averaged WSS (TAWSS) of controls and treated hearts. (I) Oscillatory shear index (OSI) of treated hearts I, II, III, and IV at inlet and outlet regions. Note that OSI of controls was nearly zero based on the calculated oscillatory velocity index |
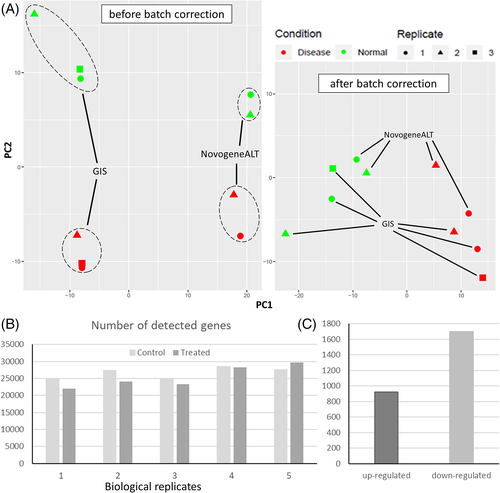
(A) Left: PCA plot of biological replicates sequenced by GIS and NovogeneALT and two clusters of different biological conditions (green markers were controls and red markers were treated samples) was distinguishable. Right: PCA plot of the expressions after removal of batch effects accounting for differences of the two service providers. (B) Number of detected genes in each sample from five independent experiments (N = 5) where biological replicates 1–3 were sequenced by GIS and biological replicates 4–5 were sequenced by NovogeneALT. (C) Number of significantly up-regulated (FDR ≤0.05 and log FC ≤−1) and down-regulated genes (FDR ≤0.05 and log FC ≥1) |

Real-time RT-qPCR validation of a subset of differentially expressed genes between control and BDM-treated hearts. Expression of genes of interest were first normalized to a housekeeping gene (actb) and then plotted as relative to expression levels in control. Data were presented as mean ± SE. Sample size was three for (A–I) but limited to two only for (J, K) as the expression level in some treated samples for col15a1b and erbb4a were too low to be detected. For (A–I), statistical test was one-way ANOVA test, where *P < 0.05 |

Correlation of log2 FC of nine genes (Figure 7A–I) between RNA-seq and quantitative real-time PCR (RT-qPCR). A strong, statistically significant Pearson correlation (R = 0.9269) was shown between the expression levels detected using RNA-seq and real-time PCR. Each data point represented the mean value of three biological replicates |

Confocal images of GFP+ myocardium. Extensive trabeculae formation (white arrowheads) was evident in control hearts (A). Inner linings of the BDM (B) and blebbistatin-treated hearts (C) remained smooth, which is a common sign of an under-developed myocardium. Scale bars: 50 μm |
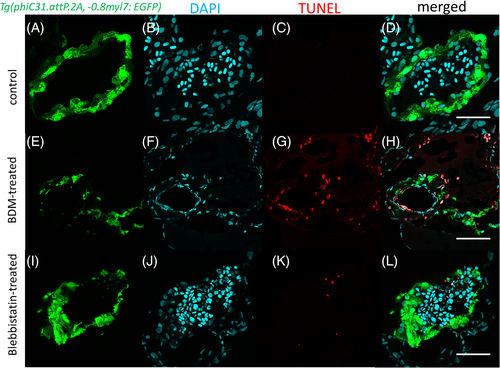
Apoptosis detection in BDM- and blebbistatin-treated zebrafish embryonic hearts using TUNEL assay. Apoptotic cells (red) were detected in the endothelium and myocardium (G, K) of treated hearts. Scale bars: 50 μm |
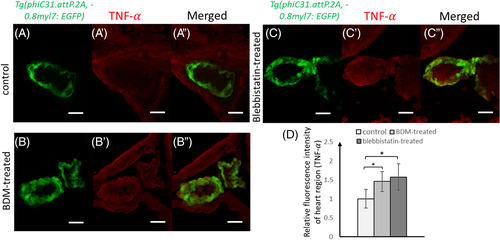
Immunofluorescence staining of Tnf-α on cryo-sectioned embryonic tissues. GFP-positive myocardium (A–C) and Alexa Fluor 568 dye which indicates Tnf-
 (A′–C′) are displayed. Relative fluorescence intensity plot of heart region (D) indicates that Tnf-α was significantly up-regulated in treated hearts (n = 5 for each group). Mean and standard deviations are shown, and a two-sample t-test was used, where *P < 0.05. Scale bars: 50 μm (A′–C′) are displayed. Relative fluorescence intensity plot of heart region (D) indicates that Tnf-α was significantly up-regulated in treated hearts (n = 5 for each group). Mean and standard deviations are shown, and a two-sample t-test was used, where *P < 0.05. Scale bars: 50 μm |

Schematic diagram showing several possible mechano-responsive pathways of a malformed heart after a 3-day BDM treatment |