
- Title
-
IMPDH forms the cytoophidium in zebrafish
- Authors
- Keppeke, G.D., Chang, C.C., Antos, C.L., Peng, M., Sung, L.Y., Coelho Andrade, L.E., Liu, J.L.
- Source
- Full text @ Dev. Biol.
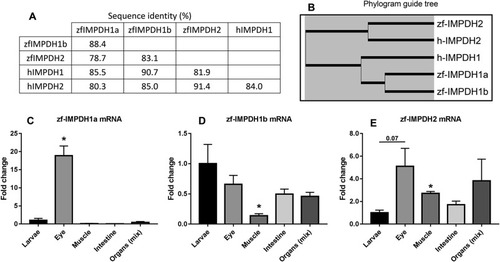
Fig. 1. Differential expression patterns of three zfIMPDH isoforms. (A) Protein sequence comparison between human and zebrafish IMPDH isoforms. (B) Phylogram guide for human and zebrafish IMPDH sequences. (C–E) Relative mRNA levels of zfIMPDH isoforms in different tissues. n = 4 adult specimens and n = 2 larval specimens (10 dpf). Larval Ct average was considered as 1. (Error bars = S.E.M. ∗p < 0.05, t-test). |

Fig. 2. Diverse zfIMPDHs cytoophidium-forming properties in vitro. (A–C) zfIMPDH isoforms were cloned with N-terminal tags and expressed in HeLa cells. Immunofluorescence probing on transfected HeLa cells under conditions with or without treatment of MPA (100 μM for 2 h). Myc-tag, HA-tag and Flag-tag are shown in red and antibody against IMPDH is shown in green. Cytoophidia formed by zfIMPDH are indicated by arrows in B and C. The proportion of cells with cytoophidia and the number of cells were counted (n) is shown below each panel. (D) HEp-2 cells expressing zfIMPDH1a were treated with DON (100 μM for 2 h) before fixation. Cytoophidia and clumps that contain zfIMPDH1a are indicated by arrows and arrowheads, respectively. Scale bars = 10 μm. (E) Bar graph showing the quantification of the proportion of zfIMPDH expressing HEp-2 cells with cytoophidia or clumps. Only transfected cells were counted and the number of cells counted in each group is shown as (n). (Error bars = S.E.M. ∗p < 0.05; ∗∗p < 0.01; ∗∗∗p < 0.001, proportions were compared by t-test with the respective isoform without treatment.) In all groups with MPA treatment, endogenous cytoophidia in non-transfected cells are labeled by the α-IMPDH antibody. |

Fig. 3. Disruption of zfIMPDHs cytoophidium-forming properties with point mutations. (A) Sequence comparison of human and zebrafish IMPDH isoforms at regions around Lys12 and Arg224. (B) Immunoblotting of HeLa cells expressing WT or Y12A mutant zfIMPDH isoforms under conditions with or without MPA treatments shows similar expression levels of WT and Y12A mutant zfIMPDHs. (C–F) Immunofluorescence of HEp-2 cells expressing Y12A or R224P mutant zfIMPDH1b and zfIMPDH2. Cells were treated with MPA or DON for 2 h before fixation. Asterisks in panels C and E indicates the cells with endogenous cytoophidia, but not the zf-IMPDH cytoophidium. Arrows and arrowheads in panels D and F indicate zfIMPDH cytoophidia and clumps, respectively. Scale bars = 10 μm. (G) Quantification of the proportion of HEp-2 cells with zfIMPDH cytoophidia or clumps under the conditions shown in (C–F). Only transfected cells were counted and the number of cells counted (n) is shown for each group. Error bars = S.E.M. With MPA and DON treatments, non-transfected cells also present endogenous cytoophidia, which are labeled by the α-IMPDH antibody. |

Whole-mount immunofluorescence of 8dpf larvae with anti-IMPDH2 antibody (shown in green) and DAPI (magenta). (A) Cytoophidia in the eye. (B) Zoom-in view of selected region in (A). (C) Ventral view of the head of larva. (D) Many cytoophidia were observed in the Meckel's cartilage (highlighted by yellow dashed lines in (C) and (D). (E) Zoom-in view of selected region in (D). (F) Cytoophidia were observed in the operculum. (G) Magnified image of selected region in (F). (H) Ventral view of ceratobranchials. (I and J) Zoom-in view of selected area in (H). The auto-fluorescence (red) shown in (J) reveals the contour of pharyngeal teeth, with abundant cytoophidia. (K and L) Some cells in the fin display cytoophidia. Arrows in all panels indicate cytoophidia. Scale bars = 50 μm in (A), (C), (H) and (K); 20 μm in (D), (F), (I) and (J); 10 μm in (B), (E), (G) and (L). EXPRESSION / LABELING:
|

Fig. 5. MPA promotes IMPDH cytoophidium assembly in olfactory organ of larvae. Immunofluorescence images of the olfactory organ of 8 dpf larvae treated with 0.1% DMSO (A) or 100 μM MPA (B) for 1 day. (A′ and B′) Magnified images of selected areas in (A) and (B). IMPDH is shown in green and tubulin is shown in magenta. Scale bars = 20 μm in (A) and (B); 10 μm in (A′) and (B′). |

Fig. 6. IMPDH forms cytoophidia in the retina and teeth of adult fish. Immunofluorescence images of retina and teeth of adult zebrafish cryosections for IMPDH (green) and DAPI (magenta). (A–D) Abundant cytoophidia were observed in the outer nuclear layer and outer plexiform layer of the retina (arrows in C), and some were found in the rods and cones layer (A–C), but no cytoophidia were detected in the cornea (D). Highlighted by yellow dashed lines in (A″ and B″) is the region where photoreceptor cells are located. (B) Magnified image of selected region in (A). (C) Magnified image of selected region in (B). GC = ganglion cells, IPL = inner plexiform layer, INL = inner nuclear layer, OPL = outer plexiform layer, ONL = outer nuclear layer, R&C = rods and cones, PCL = pigment cell layer. (E–J) Cytoophidia were present in cells in the interior of teeth at early differentiation cap and bell stages (highlighted by yellow dashed lines in E and H), but not in the late eruption phase (J). (F and G) Magnified image of selected region in (E). (I) Magnified image of selected region in (H). Arrows in F, G and I indicate cytoophidia. Scale bars = 50 μm in (E); 20 μm in (A) and (H); 10 μm in (B), (D), (F), (G), (I) and (J). EXPRESSION / LABELING:
|

Fig. 7. IMPDH forms cytoophidia in pseudobranch and the primary lamella of the gill in adult fish. Immunofluorescence images of pseudobranch and gill of adult zebrafish cryosections for IMPDH (green) and DAPI (magenta). (A–D) Abundant cytoophidia were observed throughout the pseudobranch of the fish, highlighted in (A) by dashed lines. (B) Magnified image of selected region in (A). Arrows indicate cytoophidia in (B, C and D). (E–I) Cytoophidia were found in the primary lamella chondrocytes of the gill's cartilaginous support. In many cells cytoophidia were located in the nucleus (I). (F and G) Magnified images of selected regions in (E). Arrows indicate cytoophidia in (F–I). Scale bars = 50 μm in (A); 20 μm in (E); 10 μm in (B–D) and (F–I). EXPRESSION / LABELING:
|

Fig. 8. IMPDH forms cytoophidia in the ovary of adult fish. Immunofluorescence images of the ovarian tissue of adult zebrafish cryosections for IMPDH (green) and DAPI (magenta). (A–E) Cytoophidia were observed in the vitellogenic and pre-ovulatory follicles. Cytoophidia were frequently located in the thick zona radiata of oocytes (B). Arrows indicate the cytoophidia in (B–E). Scale bars = 100 μm in (A); 10 μm in (B–E). (F) Quantification of cells presenting cytoophidia in the different tissues of adult fish. (n) indicate the number of cells counted. Error bars = S.D. EXPRESSION / LABELING:
|

ZFIN is incorporating published figure images and captions as part of an ongoing project. Figures from some publications have not yet been curated, or are not available for display because of copyright restrictions. EXPRESSION / LABELING:
|
Reprinted from Developmental Biology, 478, Keppeke, G.D., Chang, C.C., Antos, C.L., Peng, M., Sung, L.Y., Coelho Andrade, L.E., Liu, J.L., IMPDH forms the cytoophidium in zebrafish, 89-101, Copyright (2021) with permission from Elsevier. Full text @ Dev. Biol.