FIGURE SUMMARY
Title

Ciliary rootlet coiled-coil 2 (crocc2) is associated with evolutionary divergence and plasticity of cichlid jaw shape

Authors
Gilbert, M.C., Tetrault, E., Packard, M., Navon, D., Albertson, R.C.
Source
Full text @ Mol Bio Evol

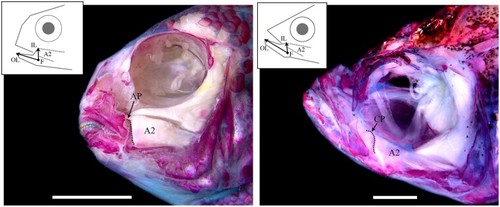
Functional anatomy of the cichlid and zebrafish head. A dissected and alizarin red stained head of a representative cichlid, Tropheops sp. “red cheek”, is depicted at left, and a zebrafish is shown at right. Craniofacial bones are red, and muscles are white. The lever mechanism that defines the mechanical advantage of jaw closing is illustrated for each species, whereby the jaw joint acts as the fulcrum (F), jaw length is the out-lever (OL), and a dorsally projecting bony process, on which the second subunit of the adductor mandibulae (A2) inserts, acts as the in-lever (IL). In cichlids, the in-lever is the ascending arm of the articular (AP), whereas in zebrafish it is the coronoid process (CP). Thus, in each species, this functional system is comprised of nonhomologous bony processes. Scale bar equals 1 cm in the cichlid image (left), and 1 mm in the zebrafish image (right).

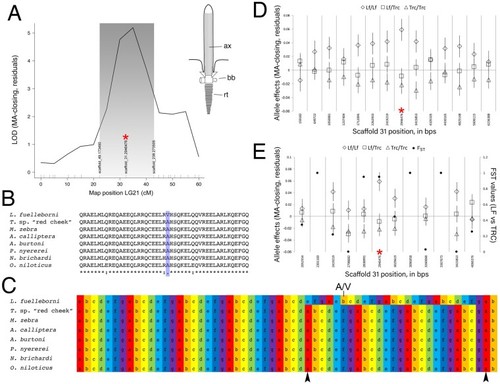
Mapping of lower jaw mechanical advantage in cichlids. The QTL for relative height of the articular process (i.e., mechanical advantage of jaw closing, “MA-closing”) maps to LG21 and peaks over a marker on physical scaffold number 31 (A). A schematic of a primary cilium is shown in (A) as well, where “ax” is the axoneme, “bb” is the basal body, and “rt” illustrates the striated rootlet. The SNP at the QTL peak (red asterisk) encodes a nonsynonymous (A/V) polymorphism within Crocc2, where the A allele is conserved across African cichlids (B), and is associated with two predicted interruptions (arrowheads, C) in the heptad repeat (i.e., denoted, and color-coded, a–g). The V allele in LF is predicted to result in contiguous heptad repeats in this region of the protein (C). With additional markers every ∼0.5 Mb, we queried the phenotype–genotype relationship along scaffold 31, and show that the peak association remains at ∼2.9 Mb (red asterisk, D). We sought to refine the interval even further using markers every ∼100-200 kb, between ∼2–4 Mb on scaffold 31, and find that the peak association holds at the crocc2 SNP (red asterisk, D). Further, this marker is nearly alternatively fixed between -wild populations of LF and TRC (e.g., FST = 9.5).

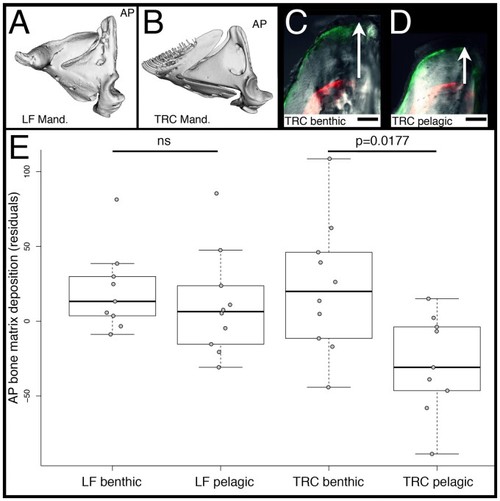
Rates of bone matrix deposition in cichlids. Mandibles of LF (A) and TRC (B) are shown, and the ascending arm of the articular bone (AP) is labeled. The tip of the AP in TRC reared in either a benthic/biting (C) and pelagic/sucking (D) environment is shown. Panels (C and D) are overlays of bright field, GFP, and RFP illumination. The RFP filter shows where alizarin red was incorporated into the bone. GFP is the calcein green label 5 weeks later. The distance between labels (white arrows) represents the amount of matrix deposited during that time. Scale bars equal 50 µm. Quantification of the rates of bone matrix deposition are shown in (E). Significance was determined via an ANOVA followed by a Tukey’s multiple comparison test.

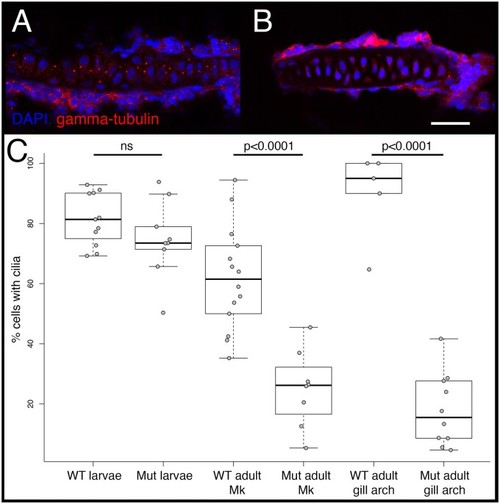
Cilia number in WT and mutant zebrafish. Cilia were visualized via immunohistochemistry using either anti-gamma-tubulin (shown), which labels the basal bodies, or anti-alpha acetylated-tubulin (not shown), which labels the axoneme, and imaged via confocal microscopy. Representative images are shown for the gill arch cartilage in WT (A) and full-sibling crooc2 mutants (B). Scale bar equals 20 µm. Quantification of cilia number per cartilage, calculated as the percentage of nondividing cells containing cilia, is shown in (C). Significance was determined via an ANOVA followed by a Tukey’s multiple comparison test. In larval (4dpf) fish, each data point represents a count from a different cartilage across n = 3 WT and n = 3 crocc2 mutant animals. In adults (>12 months), data points represent counts from different sections of Meckel’s cartilage (i.e., Mk), or from different gill arch cartilages. Sample sizes for adults are also n = 3 for each genotype.

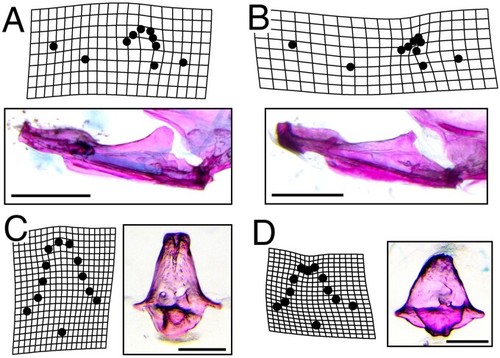
Dysmorphic bone geometry in crocc2 mutants. A geometric morphometric shape analysis was performed on various element of the feeding apparatus in WT and crocc2 mutant fish. Mutants exhibit distinct mandible shapes compared to WT siblings, with the most conspicuous differences occurring in the size and shape of the coronoid process (B vs. A). Scale bars in (A) and (B) equal 1 mm. Shape differences were also noted for the kinethmoid, with mutants exhibiting an overall shortening of the element in the dorsal–ventral dimension (D vs. C). Scale bars in (C) and (D) equal 200 µm. Deformation grids represent commonly seen phenotypes in the mandible, and exaggerated mean shapes in the kinethmoid. Procrustes ANOVA with post-hoc pairwise comparisons of group means (procD.lm, advanced.procD.lm), was significant for mandible mean shapes at P = 0.02, and for kinethmoid means at P = 0.12.

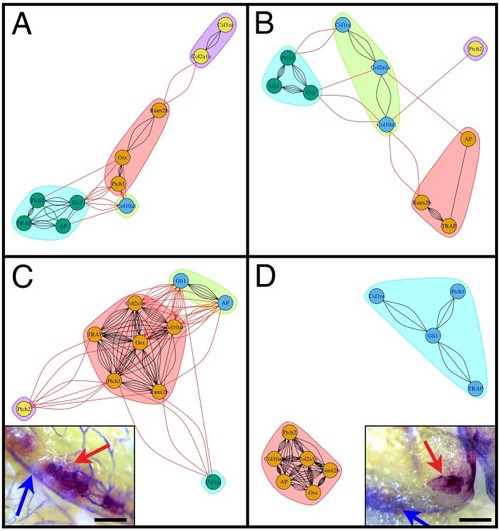
Mis-regulation of the bone marker gene expression in crocc2 mutants. Network output of partial correlations (from table 2). Red lines represent correlations between genes in different modules, whereas black lines represent correlations within modules. Colors denote distinct modules in each analysis. Panel (A) illustrates the interaction between bone marker expression in WT animals at the young adult stage (3–5 months), whereas panel (B) shows data for comparably staged mutants. Note that, although there are a greater number of correlations in WT versus crocc2 mutant animals, both networks are characterized by four interconnected modules. Covariation of gene expression in old adult (10–15 months) bone is shown for WT (C) and mutant (D) animals. WT zebrafish show a relatively high number of correlations both within and between modules, consistent with a tightly integrated gene network. Alternatively, mutants show a dissociated pattern characterized by two distinct modules, which is reflected in in vivo patterns of bone cell activity (insets, C and D). In WT bone (i.e., interopercle), TRAP and AP are generally in close approximation, whereas in mutants these factors are often expressed in distinct areas of the bone. Scale bars equal 200 µm.

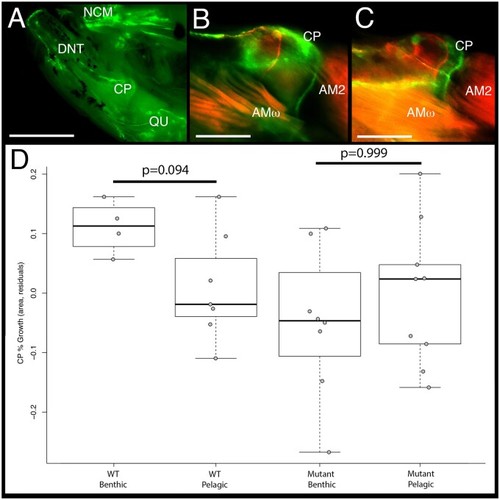
Rates of bone matrix deposition do not respond to environmental stimuli in crocc2 mutants. Bone deposition rate was measured as the ratio between the area of the coronoid process (CP) at time 0 (red label) over the area at time 1 (green label) in WT and crocc2 mutant zebrafish reared under alternate foraging regimes. Panel (A) shows the medial view of the oral jaw skeleton, under GFP illumination, depicting the anterior neurocranium (NCM), dentary (DNT), CP, and quadrate (QU). Scale bar for (A) equals 1 mm. Panel (B) depicts a composite image of red and green fluorochromes in the CP of a WT animal, whereas panel (C) shows the CP of a crocc2 mutant. Two subdivisions of the adductor mandiblae can be seen in (B and C)—AM2 and AMω. Scale bars in (B) and (C) equal 200 µm. Panel (D) presents the results of a comparison of bone deposition rates. Pairwise significance was assessed via an ANOVA followed by a Tukey’s multiple comparison test.

Acknowledgments
This image is the copyrighted work of the attributed author or publisher, and ZFIN has permission only to display this image to its users. Additional permissions should be obtained from the applicable author or publisher of the image. Full text @ Mol Bio Evol