
- Title
-
Acoustofluidic rotational tweezing enables high-speed contactless morphological phenotyping of zebrafish larvae
- Authors
- Chen, C., Gu, Y., Philippe, J., Zhang, P., Bachman, H., Zhang, J., Mai, J., Rufo, J., Rawls, J.F., Davis, E.E., Katsanis, N., Huang, T.J.
- Source
- Full text @ Nat. Commun.

|
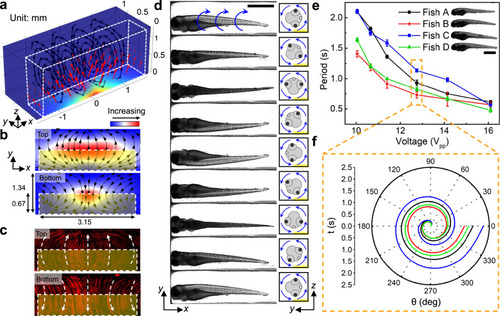
a Results from numerical simulation show that the body force (red arrows) generated by leaky SAWs can induce a vortex streaming pattern within the IDT area. The body force is applied to the liquid above the IDT which is highlighted by the white dashed box. The color of the channel indicates the amplitude of the body force. b Numerical and c experimental demonstration of acoustic streaming in the zebrafish rotation area on the xy-planes close to the channel top and bottom, respectively. The yellow shaded box indicates the IDT area. The experimentally measured streaming pattern (c) represented by the trajectories of 1-μm diameter fluorescent particles, as visualized in a composite of stacked images, matches with the numerically calculated streaming pattern (b) driven by acoustic leaky waves generated by the IDTs. d Image sequence showing a cycle of the rotational motion of a 5 dpf anesthetized zebrafish larva in the acoustofluidic device. The larva was stably rotated counterclockwise with respect to the yz-plane by the fluid-induced drag force. Scale bar: 1 mm. e The rotation periods of four typical 5 dpf zebrafish larvae (length: 3.43–3.6 mm, width: 0.63–0.71 mm) as a function of the driving voltage (Vpp). The rotational periods vary among larvae since each larva has unique characteristics for body shape, size, and density distribution. Overall, the rotational speed of the zebrafish larvae increases as the driving voltage increases. Data are graphed as the mean ± SD (n = 6). Scale bar: 1 mm. f The rotation angle over a single rotational cycle with respect to time for four typical zebrafish larvae at 12.75 Vpp. Source data is available as a source data file. |
|

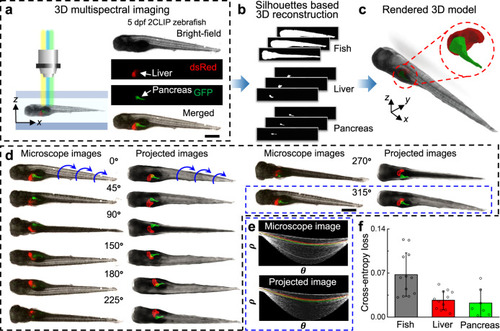
a Zebrafish larvae were raised in egg water containing 1.5% EtOH at 4 dpf and cultured for 24 h. The control group was raised without EtOH exposure for comparison. Both groups of larvae were imaged and digitally reconstructed at 5 dpf to compare and evaluate the morphological abnormalities induced by EtOH. b, c Qualitative 3D morphological assessment of zebrafish larvae by comparing the 3D reconstructed models of three zebrafish larvae from the control group (b) and from the 1.5%-EtOH group (c), respectively. The reconstructed 3D models show that acute EtOH exposure can induce morphological abnormalities in the zebrafish body, which includes edema and tail curling. d Distribution of normal vectors on the surface of reconstructed 3D models of a zebrafish larva from the control group and 1.5%-EtOH group, respectively. e Distributions of the angle (θ) between normal vectors and the x-axis for 3D models of a larva of control group and three larvae of 1.5%-EtOH group with increasing degrees of edema and tail curling. The angles of the anterior two thirds and posterior one third of the larva are calculated to quantify the level of edema and tail curling, respectively. With larger deformations, the angles have a wider distribution based on the histogram and Gaussian fitting curve, as reflected on the value of the variance (σ2). The “abnormality factor” (𝑅=𝜎2/𝜎20) shows the degree of morphological abnormalities by calculating the ratio of variances in the larvae of the 1.5%-EtOH group (σ2) and the averaged variance of the control group (𝜎20𝐸=0.0237±0.0091 and 𝜎20𝑇=0.0085±0.0032; n = 15). Scale bar: 1 mm. Source data is available as a source data file. |

a Gaussian fitting curves of the angle distribution statistics of 15 larvae in the control group. The averaged variances of the angle distribution for edema and tail evaluation are 𝜎20𝐸=0.0237±0.0091 and 𝜎20𝑇=0.0085±0.0032, respectively. b Statistical distribution of the “abnormality factors” (𝑅=𝜎2/𝜎20) for edema and tail curling in the control group (n = 15) and the 1.5%-EtOH group (n = 35). Based on statistical analysis, the larvae within the range of R ≤ 1.5, 1.5 < R ≤ 4, and R > 4 are categorized as unaffected, moderate, and severe, respectively, for morphological abnormality level. c The percentage of phenotype classification (as unaffected, moderate, or severe) of the morphological abnormalities after the 1.5% EtOH exposure. Source data is available as a source data file. |

|